
Monthly Market Update – August 2018
MACRO – REVIEW
Equities mostly had a slightly better month in July with strong Q2FY18 results helping S&P 500 (SPX) up 3.5%, while NASDAQ rose just over 2% but for US IT, some of the recent moves have been stark: at one point, FACEBOOK led the FAANGs down 9.6% in three days. STOXX 600 rose over 3% helped by a weaker EURO and Asia ex-Japan (AXJ) underperformed developed markets (DM), rising just 34bps. However, A-shares finally rose after closing lower for several months as its key 2,700 support held while foreign institutional investors (FIIs) bought AXJ equities over the last two weeks after two months of heavy selling lately. The rally in global equities stuttered after the US indicated it might increase tariffs to 25%, from 10%, on an extra $200bn worth of imports from China, thereby knocking hopes of potential de-escalation of trade tensions. This was in contrast to the more positive tone which was set when the US agreed to postpone tariffs on EU auto imports.
There were mild moves in fixed income (FI) with the bell-weather UST 10y yield gaining 10bps to test its 3% key resistance, but with little change to the yield. German Bunds’ yield rose sharply by close to 15bps to 44bps. That helped support EUR against USD, despite a ‘dovish’ European Central Bank (ECB) meeting. After the heavy prior months declines in investment grade (IG) and high yield (HY) credit, there was some recovery last month which also helped emerging market (EM) HY bonds. Fears over CNY weakness, which fell by close to 3% against USD, persisted as the People’s Bank of China (PBoC) declined to intervene. JPY eased off by -1% as its ‘safe haven’ position suffered erosion in favour of USD after the Bank of Japan (BOJ) remained ‘dovish’ in last week’s meeting. DXY again moved through key resistance at 95, although it displayed greater strength versus EM FX than DM FX. Oil fell sharply by over 6% from close to $80/brl to test key support at $71/brl on supply-side concerns, including the possible release from US’s strategic reserve. Gold moved inversely to USD gains to fall over 2% through support of $1,220/Oz.
MACRO – OUTLOOK
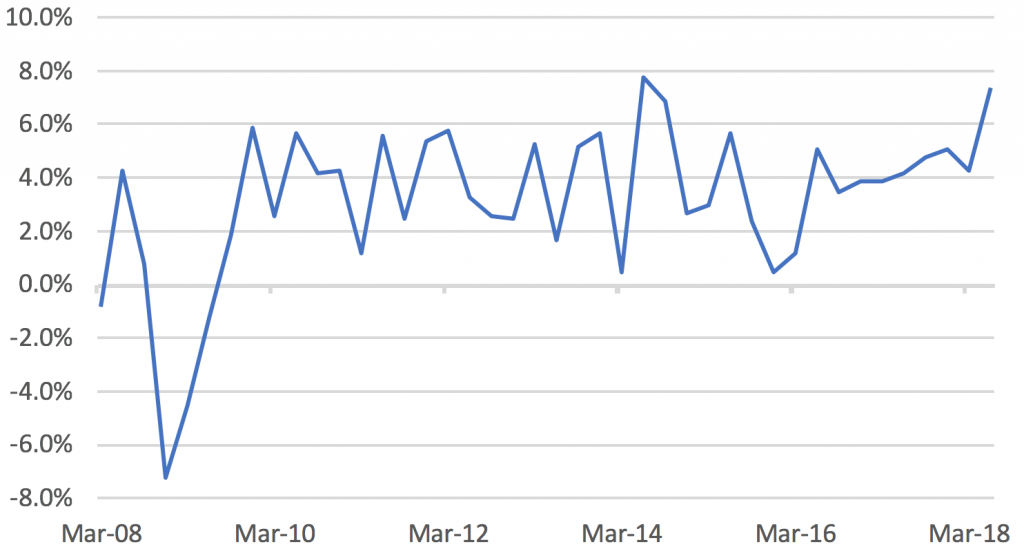
Fig 1. US GDP annualised QoQ growth | Source: Bureau of Economic Analysis
There is reason to be more positive following the US Q2 GDP result. Nominal GDP grew 7.4% (Fig 1) – almost China- like – as the real number of 4.1% was adjusted by a 3.3% deflator. Final sales were +5.3% while GDP was dragged down by inventory destocking, with only moderate evidence of trade war ‘front running’ seen in net exports. The fact that US savings rate has been materially raised is encouraging for consumer spending and services, which accounts for 88% of GDP. The resilient private sector fixed asset investment (FAI) is also constructive and the fact that part of it is from Energy Exploration & Production (E&P) pick-up is hardly a surprise given higher oil prices. Indeed, with major oil companies having slashed FAI by over 50% from H2CY14-CY16, a change of direction suggests this will be supportive for private sector FAI, job creation and higher wages going forward.
We have expected that US fiscal spending will kick-in with effect from H2CY18 onwards into much of CY19. It is interesting to note the pick-up in fiscal spending by the public sector outside the Federal government whilst Congress has voted to boost defence spending recently. There is a strong link between rising property prices and higher tax revenues at a state and local government level and this was an area that got savaged in the post-GFC period along with huge job cuts.
All in all, the detail is more encouraging, showing that the US economy is in a ‘sweet spot’ cyclically and this might persist until at least H2CY19. The higher savings rate (Fig 2) supports continued robust consumption along with rising wages, limited unemployment, rising house prices and reduced income tax rates. Private sector FAI may well be underpinned by a strong recovery in energy FAI linked to higher oil prices (we think prices will go higher in the next few years) along with tax cuts. Lastly, the bulk of the fiscal boost – estimated at 80bps directly onto GDP – comes into effect from H2CY18 through much of CY19. This all suggests that the second longest economic expansion on record could easily last through ’19.
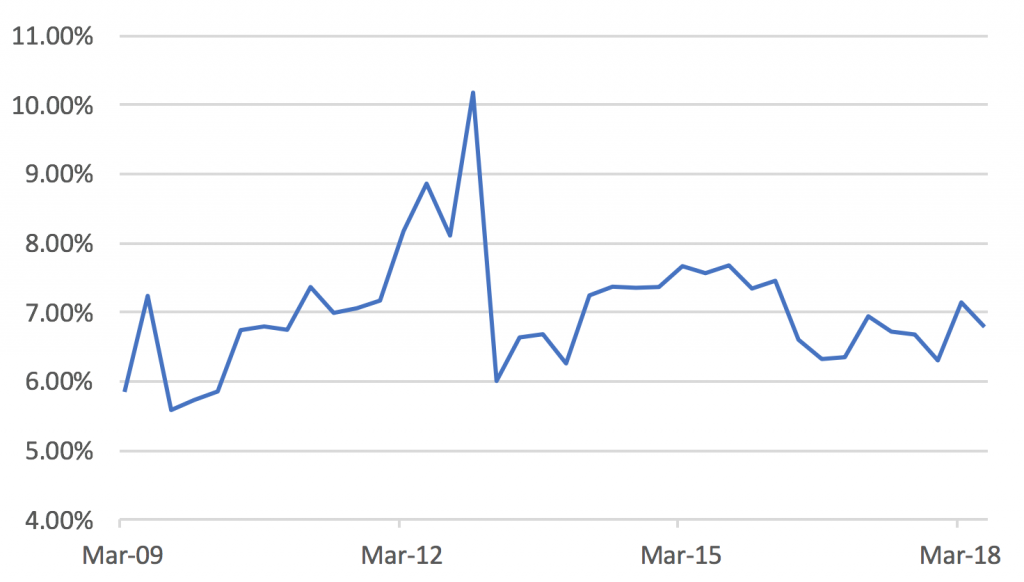
Fig 2. US Personal savings rate | Source: Bureau of Economic Analysis
Nominal GDP growth of 7.4% is a ‘heady’ number in anyone’s language, and it surely implies of a build-up in inflationary pressures. It supports the Fed’s plan for two further rate increases in CY18 and more in CY19. It is hard to see how it can be argued the Fed is ahead of the curve, and instead supports the thesis that the Fed is behind the curve. A higher savings rate supporting consumption strength; recovering private sector FAI; likely higher oil prices; and a tight labour market, all suggest that the 2.5% long-term Fed rate assumption that the FI markets are using – and thus the yield curve inversion – might prove to be spectacularly wrong. The strength of the economy helps Trump pursue his aggressive trade policies and may help the Republican party (GOP) in the November mid-term elections.
There is an assumption the US GDP strength is a one-off from the tax cuts and will evaporate next year, along with sharply lower SPX earnings per share (EPS) growth. This helps moderate UST yields and USD strength, as well as caution on SPX’s outlook from Q4FY18 onwards. On the other hand, there is a more positive narrative, that the US economy is structurally, as well as cyclically, stronger than the consensus might realise. Higher savings rate, combined with low unemployment, accelerating wage growth (PCE private sector wages grew +4.7% YTD from +1.7% last year) and rising house prices implies a structurally better supported level of consumption and hence, a higher rate of GDP growth (as consumption is c. 70% of GDP).
Private sector FAI has been subdued for much of the decade post-GFC and only started to pick-up in late ‘16/H1CY17. However, this pick-up comes from a low point where FAI was running below the replacement rate for several years and so there’s scope for a catch-up. Secondly, US companies, to some extent, used cheaper labour as a substitute for capital/FAI given high unemployment and weak labour costs post-GFC, but this is now inflecting more in favour of spending on capital as labour costs are rising (Fig 3). In addition, a recovery in energy FAI is an extremely important subset of overall corporate FAI given that it has been as much as one-third of overall corporate FAI. Financials, another key subset, are again increasing FAI too after large cuts post-GFC.
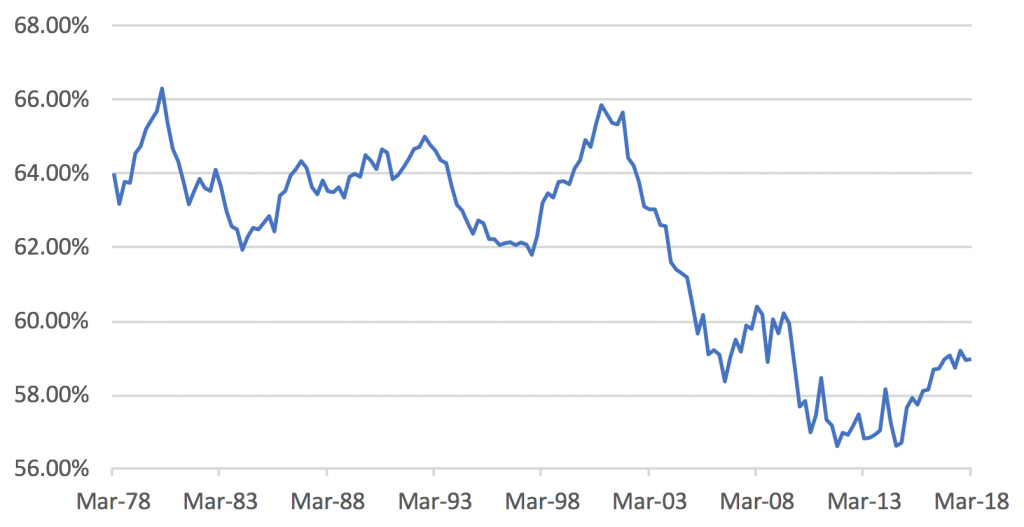
Fig 3. Unit labour costs as % of gross value added | Source: Bureau of Economic Analysis
A severe trade war, oil rocketing through $100/brl on some Middle Eastern (ME) ‘shock’ and the Fed tightening much too quickly, are all policy risks for sure, but there is a plausible case US economic strength is being underestimated for the reasons noted above. On top, the psychology of most economists and strategists is deeply rooted in extrapolating the relatively feeble post-GFC recovery out in future years. However, the US household has rebuilt its balance sheet to now the highest it has ever been in wealth, debt is under control and wages/job security are good. In other words, we may now be in a more conventional economic cycle as opposed to an abnormal one. We suspect many cannot grasp this paradigm shift. Add to this a substantial cyclical fiscal boost and US GDP might well surprise to the upside in the next few years. This obviously is supportive for a higher EPS growth, a stronger USD and a larger need for the Fed to tighten beyond its current ‘dots plot’. It might also help Trump win a second term!
Whilst we think trade tensions may remain heightened for several months, we believe China has re-considered its confrontational approach to the US and that might enable an agreement between the two over time. US’s agreement to postpone the proposed tariff on autos was another positive. Equity valuations outside the USA are looking more attractive – notably in AXJ that is trading close to lows seen outside a major crisis at around 1.2x PBV – and global GDP growth and EPS growth are both holding up so far. Admittedly, the latest move by the US to potentially increase tariffs from 10% to 25% on an extra $200bn worth of imports from China, and China’s plan to impose retaliatory tariffs on an extra $60bn worth of US imports, will not help short term volatility, but the first signs of FX intervention by PBoC to support CNY are a positive step.
We are cautious Tech on valuation grounds and concerns over the risks associated with ‘momentum-style’ retail inflows into passive ETFs, which have indiscriminately supported rising valuations – the 20%+ falls in both Facebook and Twitter illustrate these risks are not theoretical. IT accounted for 55% of the SPX’s gain YTD, near the post Tech-bubble highs and is growing at an unsustainable pace. Five companies, Apple, Alphabet, Microsoft, Amazon and Facebook, now account for over $3.5tn of market capitalisation. As Morgan Stanley notes: “The fact that Tech is so large and represents such a significant proportion of the ‘winners’ YTD makes contagion from a positioning unwind more likely now than ever.” We have warned previously that once the FAANGs stop rising, this is not simply a risk for IT (and NASDAQ) but for the wider market (IT is 26% of SPX’s weighting) and consequently, for the passive ETFs that offer no price discovery nor risk management.
US EQUITIES – REVIEW
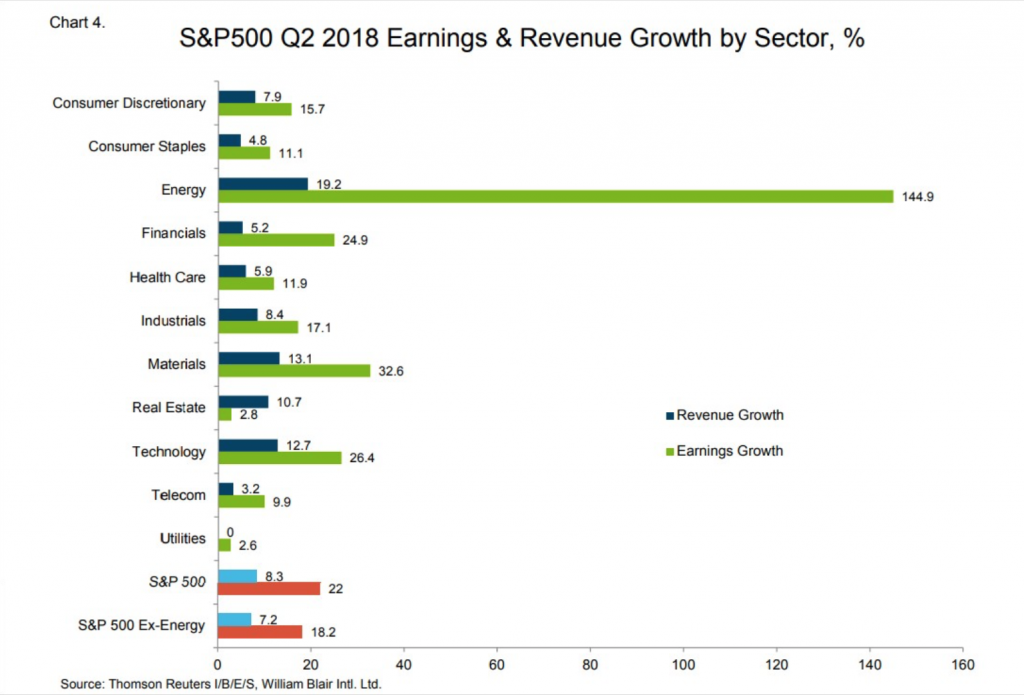
Fig 4. SPX 2Q18 earnings and revenue growth by sector
- 81% of the companies in SPX have reported Q2 results, beating estimates by over 80% in both the topline and EPS (Fig 4). The likely 27% YoY growth makes this the best quarter since the recovery year in 2010 and the best outside a recovery year since 200 Analysts started the year with FY18 forecasts at +11% and these have now been revised to +23% (Fig 5), with +10% built-in for FY19.
- Value outperformed Growth last month, in one of the best moves since 200 NASDAQ underperformed both SPX and DJIA for the first time in months, reminiscent of its sell-off in 2016. Facebook lost over 20%, and Twitter 27%, in two days. Sector moves last month also indicated some shift into defensives.
- July’s robust non-farm payroll (NFP), if adjusted for strong increases to the two prior months, and the 30bps rise in hourly wages to 7% YoY pace put the seal on a robust set of data. Q2 nominal GDP growth was a phenomenal 7.4% and real GDP growth of 4.1% was after a 3.3% deflator as final sales rose 5.3%.
- The Federal Open Market Committee (FOMC) continued to guide for robust growth after the Beige book also found growth to be broadly improving. Fed Futures are estimating a 90% probability of another 25bps hike in September and over a 60% chance of a fourth rise in Decemb
- Trump and his team are getting increasingly agitated about Robert Mueller’s investigation into Russian influence in the election campaign, which is mostly ignored as a threat by marke However, the risk is rising that something of substance, linking the Trump campaign, is uncovered.
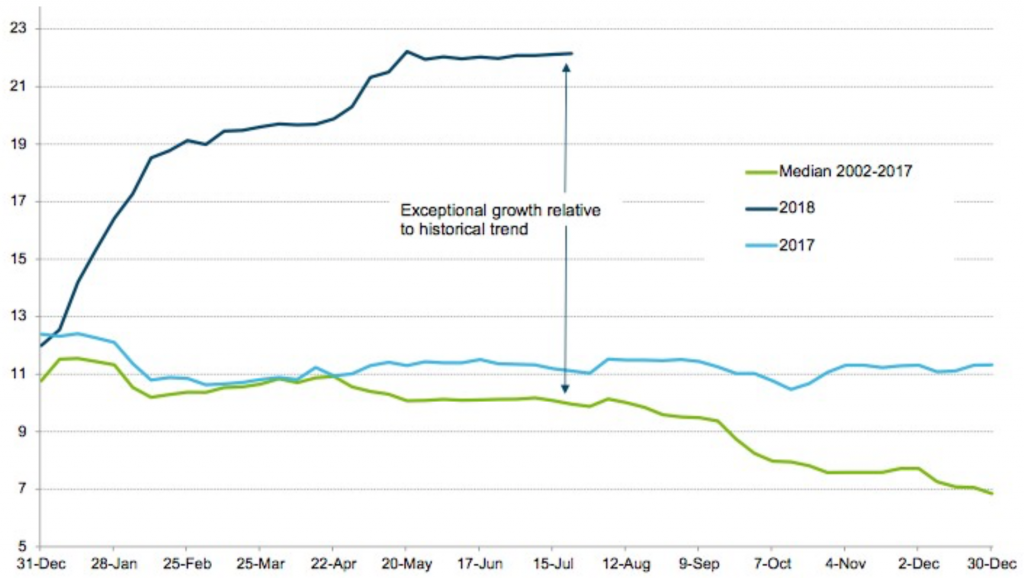
Fig 5. Weekly progression of analysts’ annual growth estimates for SPX EPS (%) | Source: William Blair
US EQUITIES – OUTLOOK
- US equities historically have derated by 10-15% as EPS growth slo On current forecasts this inflection point could be as early as Q3FY18/Q4FY18. This, along with concerns around the IT sector’s leadership, suggests caution ahead around US equities and FAANGs as we go into autumn. A key debate is revolving around whether the FY19 EPS provide evidence of slower, ‘late-cycle’ earning or, whether we are more ‘mid- cycle’ with a more robust outlook for EPS growth and strength of the USD.
- Despite the strength in Q2 GDP growth, it is likely growth might continue at a robust level, as only a small part of the Federal fiscal spending increase was spent, with around a third coming into H2CY18 and the bulk coming into CY19. Hefty inventory destocking seen last quarter should also reverse with consumption and the private sector investment will likely remain robust in H2CY18.
- The strength of the economic data and breadth of the growth will support FOMC in raising rates twice more this year, but the important debate is whether FOMC’s guidance for the long-term Fed equilibrium interest rate (R-STAR or R*) is correct at 3%. If inflation returns, the consensus R* will be proven too lo
- Even the Fed Chair, Powell, whilst criticising trade protectionism, provided ‘cover’ for short term measures against China if this was to enable lower overall tariffs in the medium to long ter Trump has minimal domestic opposition to his trade policies making risk markets volatile around his latest ‘tweets’, but the key is whether trade protectionism gets worse in the short term and for how long this lasts – past history suggests 18 months as an average. That said, some think Trump might announce a deal just before the US mid-term elections in early November.
EU EQUITIES – REVIEW
- A weaker Euro and GBP helped both STOXX and FTSE 100 gain last mon STOXX results so far are disappointing with more profit ‘misses’ than ‘beats’ despite topline beats.
- EU macroeconomic data mostly missed forecasts last month and activity in consumption, investment, exports and manufacturing hit 1-2y lo This has disappointed earlier hopes that the ‘soft’ patch in H1CY18 would stabilise and see recovery, with several sell-side houses downgrading GDP for CY18 and CY19. However, the decline, overall, is modest and comes off a higher absolute level.
- Despite some mixed messages, the ECB meeting was relatively ‘dovish’, with several strategists interpreting it to mean no rate rises until 2020 at the earli UK‘s Bank of England (BOE) raised rates by 25bps but this, too, was characterised as a ‘dovish’ move with BOE likely to be on hold until after BREXIT.
- Political risks rumble on as May just survived to the summer break, by offering just enough to the ‘leavers’ and ‘remainers’ to get through some close votes on B Likewise, the disparate coalition in Italy staggers along, despite the huge ideological differences, but could easily come back again to haunt EUR risk assets.
EU EQUITIES – OUTLOOK
- Weaker-than-expected STOXX EPS is a rite of the summer in most years since GFC (vs SPX reliably beating estimates) and will not help an unloved region if we get further EPS downgrades from consensus of +9%. STOXX is seen to be the equity region most vulnerable to trade protectionism – more so than Japan, EM and AXJ!
- FTSE 100 EPS growth is forecast to be +7% FY18, in contrast with a much stronger EPS growth last ye This forecast could be at risk due to weaker economic growth as BREXIT risks start to bite and may raise questions over the degree of cover for dividends and thus for income funds that are major investors in UK equities.
- The fractious battles within May’s Conservative party will, at some point, force her to decide on a strategy, be it ‘soft’ (as most people expect) or ‘hard’, which could trigger her government’s fall and result in fresh election Many now fear the UK government is so ill-prepared to negotiate with EU that a ‘hard’ exit, or no deal, is a growing risk for the economy, FTSE 100 and GBP.
APAC AND EM EQUITIES – REVIEW
- The latest TANKAN was quite upbeat with some indicators at their best since the ‘90s, including some positive labour market dat This contrasted with ‘hard’ data disappointments such as lower-than-expected inflation. BOJ’s recent meeting was more ‘dovish’ that some hoped with no change to its ‘yield curve control’ (YCC). Q2CY18 EPS are still mostly yet to be released, but guidance so far is encouraging.
- AXJ has continued to see EPS downgrades, notably in the IT/social media sector that led the MSCI AXJ rally last year (Tencent has lost more market cap YTD than Facebook). Estimates are now at +10% FY18 from +15%. Weaker AXJ FX has also reduced AXJ EPS in USD-adjusted terms.
- Central banks in the region are under greater pressure to tighten against USD strength while facing further pressure from a weak Indonesia, Philippines and India have all raised rates in the last few weeks to help stem FX weakness. Others are proving less ‘dovish’, although there are mixed messages from PBoC as to whether it is easing or tightening around the deleveraging issue.
- A-shares’ 20% ‘dive’ ended at a 2y-low, but the index rebounded back above key supports at 2,700 towards testing 3,000 again (Fig 6) on hopes that policy action might be taken to support the domestic economy and to limit CNY weakne Underlying macro data, although easing-off a bit, remain supportive as does profit guidance with a number of positive profit warnings.
- ASEAN equities rallied after hitting valuations that previously marked lows outside major crises with financials in the vanguard. Evidence the region’s central banks were being proactive also helped lower FX fears.
- Q2 data out shows whilst the government and FIIs sold down Indian equities heavily, this was bought by local mutual fund.

Fig 6. A-shares see support at 2,700 and moves towards testing 3,000 | Source: Bloomberg
APAC AND EM EQUITIES – OUTLOOK
- BOJ might alter its equity ETF buying pattern that hitherto has helped Nikkei 225 to be more focused on the TOPIX composition which could have some stock specific and ETF implication A continued ‘dovish’ BOJ will reduce risks of a stronger JPY – that is TOPIX positive but not so much for financials.
- AXJ and Chinese equities will take their lead from developments around trade and The latest round of USA tariff escalation, and Chinese retaliation, have dampened hopes that a more conciliatory China outlook was developing as it appears USA is determined to punish first and listen second. UBS estimates a full trade war would see AXJ EPS fall to be flat in FY18 and negative in FY19.
- On a more optimistic note, China at last appears to have taken steps to intervene against CNY weakness for the first time. That is a critical step as a breach of 00 against USD would be a dangerous move as it would indicate the use of a deliberate devaluation of CNY as a weapon against US trade protectionism and in doing so, widen the trade battle into a currency war.
- The Chinese government and PBoC, after recently hinting at an easier monetary policy and other actions to support the domestic economy, confused investors last week by repeating an earlier message of its commitment to deleveraging and further property market restraints that will limit the upside for Chinese equities, including property shares, in the short term.
- Whilst the rally in large cap Indian equities have taken valuations for the NIFTY 50 to levels that require a solid EPS recovery to come through to justify any further gains, the mid-to-smaller (SMEs) caps have seen a 30-40% sello This massive selloff offers better value and justifies a switch from larger caps, but this may require patience to see the rewards, given the damage to local investors in the SME space.
FIXED INCOME – REVIEW
- The various DM central bank meetings re-emphasised the differences in monetary policy, with FOMC highlighting a relatively robust outlook for the US economy, albeit without overheating, while both ECB and BOJ guided more ‘dovishly’ than was expected, as did the BOE.
- Bunds yield jumped 14bps+ as political risks eased-off over Italy and Germany’s coalition government as the CSU and CDU ‘kissed and made up’.
- Credit rallied modestly across the board, after the prior months’ sell-off, led by EM and global HY as investors again found sufficient value in yields, given the lack of yield elsewhere in FI, to re-ent
- More ‘hawkish’ EM central banks guidance and action saw a recovery in interest in EM local currency debt(LCD).
- Inflows continued in floating rate debt like senior bank loans, and other less liquid forms of floating rate like trade finance and private debt, given their short duration, and hence attractiveness, if rates were to rise (Fig 7).

Fig 7. Short-duration bank loans vs YTM | Source: BofAML, JPM, S&P
FIXED INCOME – OUTLOOK
- The debate around the right level of R* in the US is essentially a debate about wage inflation; longevity of this economic expansion; and the degree of slack in the labour forc The ‘doves’ think there is more ‘slack’ in the labour force than the ‘hawks’, although no one really knows the answer –the official unemployment rate is at 3.9% whilst jobless claims at 200,000 are at 50y-lows, but the wider unemployment rate is at 7.5%, and the participation rate is low.
- Our belief is that wage inflation is present and accelerating, and that an R* at 75-3% will prove to be too low. However, until that consensus is shaken, it provides an anchor for UST 10y yield at 3% and implies the yield curve will ‘invert’ possibly after Fed’s expected rate hike in September.
- Our view, for now, is that an inverted yield curve is not a sign of a recession, be it that longer term yields are mispriced after its massive quantitative easing (QE), or that the US Treasury has been issuing a lot of shorter duration pap However, the facts are that an inverted yield curve has reliably predicted a recession with an average delay of 21 months and policy errors, such as a severe trade war, could cause the next recession by late 2020.
- US Treasury issuance is set to jump massively in H2CY18 to help fund increased fiscal spending, yet the Fed is committed to reducing its balance sheet slowly but su The combination might put pressure on UST yields to rise beyond simply underlying Fed rate hikes. The Fed estimated its QE helped lower UST 10y yield by 60-80bps thus quantitative tightening (QT) might have the opposite effect on yields when issuance is set to sharply rise over the next few years.
- The sharp fall in EM HY recently has only partially reversed and we still see value in selected segments like better quality Chinese property developers and Indian steel companies. We would increase exposure from very low levels to be more neutral, but will only do so graduall Fundamentally, the credit metrics of EM borrowers are mispriced relative to greater risks in indebted DM countries.
- Admittedly, an idea for very aggressive investors would be to pick up a 19% yield in the 2027 Turkish sovereign lira bond, with the Turkish lira (TRY) having devalued hugely YTD (Fig 8). The USD 2027 Turkish sovereign yields 7.5%. It is always darkest just before dawn, but markets are likely to pressure Erdogan into accepting more orthodox economic policies or suffer a FX crisis.
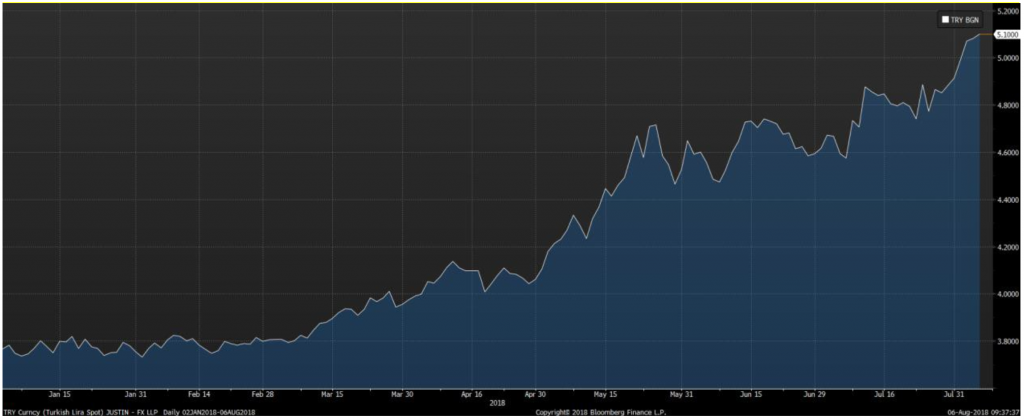
Fig 8. Extent of TRY weakness against USD YTD | Source: Bloomberg
FX – REVIEW
- For the second month in a row, the action continued to be in USD versus EM FX. Those countries with prudent economic decision making (e.g. Indonesia, India and Philippines) were rewarded with stable or strengthening currenci Others, such as Turkey, continued to worry more cautious investors and saw further large falls.
- Much of the focus was also on the free-falling CNY, and the pressure this puts on other AXJ, EM and other commodity currencies as the AU After rapidly falling over 5%, CNY stabilised to a degree last week, closing at 6.84. Real yield differential to USD has also helped CNY weakness (Fig 9).
- DXY, with weightings of 56% in EUR, 16% In GBP and 11% in JPY was relatively stable below key resistance at 95 until a weaker narrative around all three currencies saw USD gain late last week. A weaker JPY broke through a key support at 130 after the BOJ meeting failed to alter YCC guidance; GBP was testing 1.30 support on a perception the BOE rate rise might be the last for some time; and worse-than-expected EU macro data impacted EUR.
- The Indian rupee (INR) tested its all-time low close to 70 against USD before rallying after RBI hiked 25bps last week and guided for higher inflation. Other than FIIs selling down equities and INR FI, the current account deficit has also started to deteriorate quite substantially from a higher oil bill, a sharp increase in gold imports and a general rise in other impo FX markets are punishing countries running current account deficits.
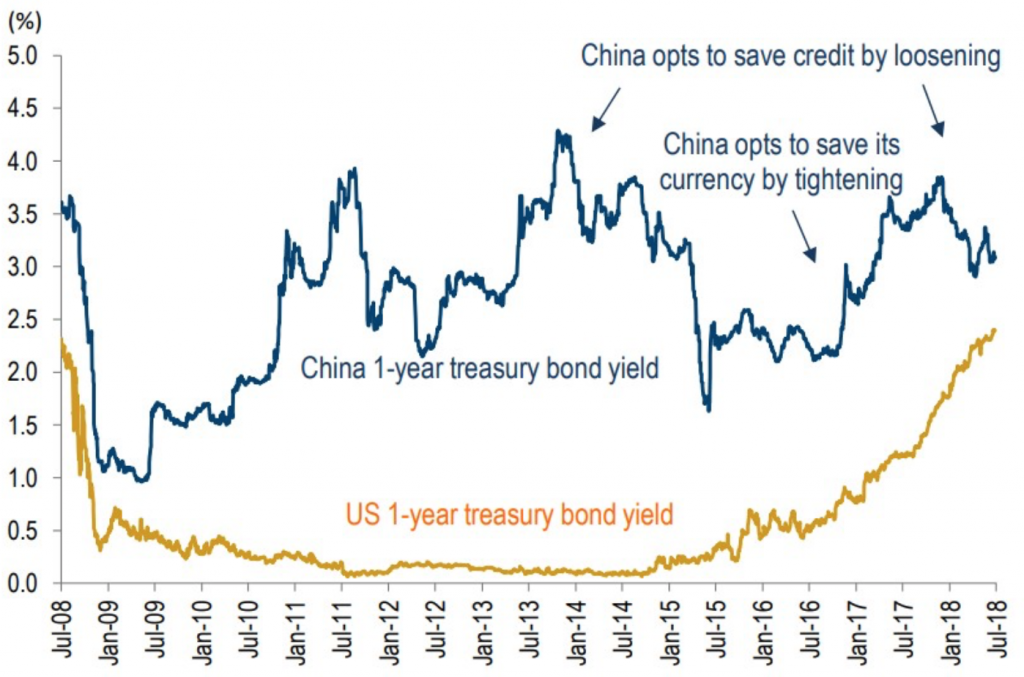
Fig 9. Narrowing China-US real yield gap | Source: CEIC, Daiwa
FX – OUTLOOK
- For now, real yield differentials are treading water in DM FX and unless US macro data firmly pushes the UST 10y yield through 3%, it is hard to see the catalyst for major moves. Consensus forecasts still cling to a stronger EUR, and a stronger JPY, against USD by YE18, linked to where some see fundamental value at 30 and 100 respectively.
- The main story in DM FX is around GBP, with several houses lowering GBP forecasts around heightened BREXIT risks (HSBC now forecasts 1.27 YE18) including UK failing to agree on any deal in time for the March ‘19 deadline. A tail risk would be if May’s government was to fall and a Corbyn-led Labour coalition was to succeed. This could see GBP test its all-time low at 1.04 set 35y
- CNY’s neglect by PBoC is a concern to us as our base case is that China wants a stable CNY and is more frightened of capital flight than ensuring greater export competiti In the past, China has indicated it would not wish to see a CNY move of more than 5-6%, which would imply more active intervention now. Should CNY stabilise, this will help AXJ and EM FX too.
- YTD, the Philippine peso (PHP) and INR, along with the Indonesian rupiah (IDR), have fallen the most versus USD but all three have seen their currencies stabilise or gain in last week or so. However, the Thai baht (THB), which had been relatively strong versus USD YTD, is now weakening as its central bank (BOT) remains on hold and ‘dovish’ (Fig 10).
- A puzzle is the resilience of SGD to USD strength and weakness in both MYR and CNY as both are large components of the SGD-trade weighted bask Should the MAS remain on hold in the October monetary policy review, the SGD could weaken sharply from here to test 1.40 if it breaks above 1.3760 key support.
- The US has highlighted it might take action against trade partners that run surpluses of over $20b This might explain the recent ‘hawkish’ comments from South Korea’s Central Bank Governor. Another country potentially at risk is Vietnam as it also fulfils the US criteria around unfair trade. However, VND has mostly tracked USD and the recovery of its FX reserves was from a pitifully low level close to requiring IMF support.
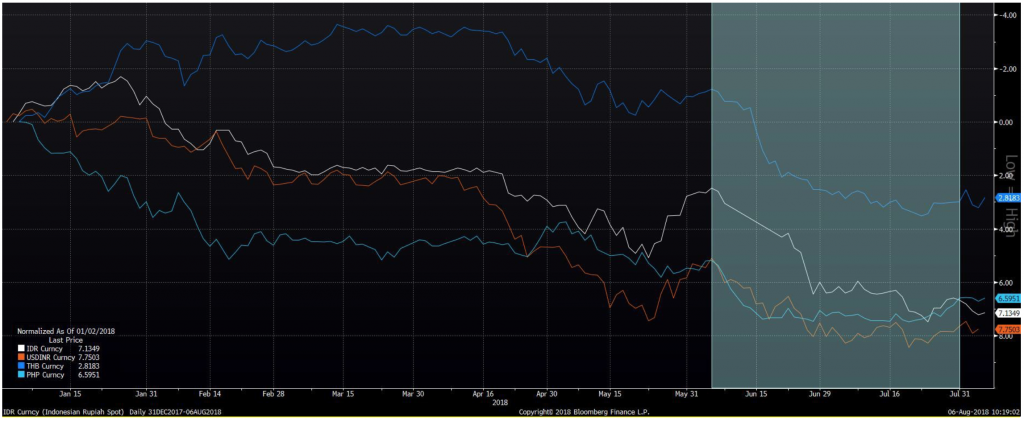
Fig 10. Percentage returns of IDR, PHP, INR and THB against USD (Inversed Y-axis) | Source: Bloomberg
COMMODITIES – REVIEW
- Brent oil fell hard over the last month from over $80/brl to test key support at $71/brl (Fig 11) after the rise in US crude oil inventories, Trump’s threat to release part of US’s strategic reserve of over 600mn/brl and Saudi Arabia’s production numbers which beat estim Oil markets ignored threats from Iran in its ‘tweet’ war with Trump – it could close down the straits of Hormuz through which 40% of globally traded oil is shipped – and an EIA report that forecast higher demand.
- Gold moved inversely to USD gains, notably against the USD/EM FX moves, as speculative investors dumped oil-backed ETFs in siz The precious metal is now testing support levels in the low $1,200/Oz area.
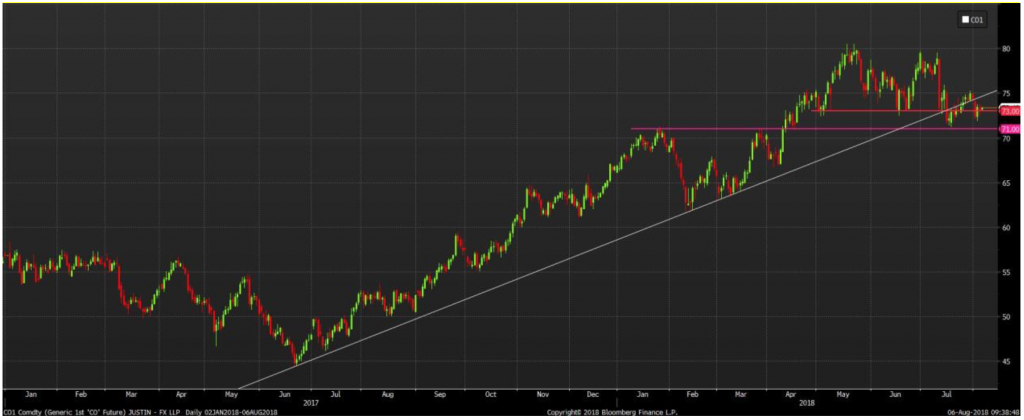
Fig 11. Brent prices testing support at $71/brl | Source: Bloomberg
COMMODITIES – OUTLOOK
- We remain cyclically positive on the outlook for the demand for oil in the next 3- Changes in regulations around shipping pollution controls could add as much as 2-3mn/bpd by 2020; and the huge 50% cut in oil E&P spending between H2CY14 through much of 2017 will leave capacity constrained by as early as 2020 too with a real risk of a supply-side ‘crunch’. Underlying global demand is rising faster than earlier forecast at closer to 1.5mn/bpd. Sell-side forecasts are noting these positives and are raising forecasts for the next few years with some expecting $100/brl by 2020.
- We remain constructive on the integrated oil majors as not only might oil prices go considerably higher, but these companies have radically reduced costs of upstream production by as much as 40-50% and thus are generating substantial free cash flows that easily cover capex and dividends yet valuations do not reflect the upside from these positive fundamental development
- There is strong support for Gold at $1,180/Oz (Fig 12) and we remain of the view gold offers defensive portfolio diversification attractions in a period FI might prove costly as a defensive asset clas However, timing is all and until USD gains start to peter out, Gold might continue to fall, but clearly much of the speculative interest has been whittled away.

Fig 12. Gold heading towards strong support at $1,180/oz | Source: Bloomberg
HOW WE MANAGE RISK – PORTFOLIO PROTECTION, HEDGING & TAKING PROFITS
As opposed to just going to cash, we prefer alternative strategies such as hedging via options and option writing strategies to smooth out portfolio volatility.
We also actively monitor profits using trailing stop losses with the view of protecting and locking in gains.
PORTFOLIO MANAGEMENT SERVICES
Please let us know if you would like to hear more about our Discretionary Portfolios and how we consistently generate an additional 0.5% to 1% per month using our Options Overlay.
CONTACT
We would be more than happy to have an informal chat about these and the other services we offer as well as the current opportunities we are looking at.