Capital Pulse – July 2020
Welcome to the June issue of Capital Pulse, Odyssey Corporate Advisory’s quarterly publication that focuses on major capital and financial markets events that occurred during the quarter and its potential implications for you and your business.
Odyssey Corporate Advisory is an independent boutique consultant providing business advisory, investment consultancy, project management and coordination services for companies that intends to access the Hong Kong capital markets.
Secondary listings are likely to remain the flavour of the month, if not the year. So, what are secondary listings and is this a money-making opportunity for investors? Are there any shareholder rights implications for investors owning secondary listed companies in Hong Kong compared to primary or dual-primary listed companies?
HEDGING LISTING POSITIONS
We provided an introductory discussion on secondary listing in the June edition of Lex Capitis. In this month’s Capital Pulse, we delve deeper into this category of listed companies and the renewed interest in this space.
The possible legislation of the Holding Foreign Companies Accountable Act (“HFAA”) and the timely creation of Chapter 19C in the Stock Exchange of Hong Kong (“Exchange”) listing rules (“Listing Rules” ) late last year has revitalised secondary listings in Hong Kong.
The recent listings of Alibaba, Netease and JD.com have raised HK$163.04 billion, and further similar secondary listings are expected. With the exception of these recent secondary listings, such listings have traditionally been far and few.
Typically, companies secondary list in Hong Kong because their business has a major exposure to Asia, but their home stock exchange is not based in Asia. Alternatively, Asian companies obtain a secondary listing in Hong Kong because most of its business are concentrated in Hong Kong and/or China.
However, from an investor point of view, secondary listings do not offer much to investors, unless there is an arbitrage opportunity in the IPO with its already listed shares in an overseas exchange, because investors can purchase those company’s shares in their home stock exchange. The only exception to this case is mainland Chinese investors that rely on the stock-connect arrangements with overseas stock exchanges to purchase international shares.
Since 1999, Hong Kong only had 13 companies that chose to obtain a secondary listing status in Hong Kong because these companies believed their business would benefit tangibly or intangibly from a secondary listing status. However, seven of these companies has delisted predominantly due to low trading volumes of its secondary listed shares. The history of secondary listed companies in Hong Kong since 1999 is presented in Table 1 below.
Given the current geopolitical environment, the HKEX might benefit from the return of large Chinese companies listed in the USA via a secondary listing and, thus, Hong Kong retaining its status as a premier exchange to raise capital in 2020. However, with the unrelenting ravaging impact of Covid-19 on the real economy, one would wonder whether there are any more rabbits left in the hat? Perhaps recent announcement by the CEO of the HKEX not to renew his contract could be telling.
Table 1: Secondary Listings in Hong Kong
|
Stock Code |
Company Name | Country | Nature of Business | Primary Exchg. | Listing Date | Market Cap with IPO price (HKD Billion) | Delisting date | Delisting reason |
|
09618 |
JD.com, Inc. | China | Information Technology – e-commerce, retail | New York | 18/6/2020 | 596.5 | ||
|
09999 |
NetEase, Inc. | China | Information Technology – games and online services | New York | 11/6/2020 | 421.8 | ||
| 09988 | Alibaba Group Holding Ltd. – SW | China | Information Technology – e-commerce, retail, e-payment | New York | 26/11/2019 | 3764 |
|
|
| 06288 | Fast Retailing Co., Ltd. – DR | Japan | Consumer Goods – Apparel | Tokyo | 5/3/2014 | 282 |
|
|
| 06813 | CapitaMalls Asia Ltd | Singapore | Properties & Construction – Shopping Malls | Singapore | 18/10/2011 | 30.265 | 22/7/2014 |
Restructuring into Parent |
|
06388 |
Tapestry, Inc. – RS ( Formerly Coach Inc.) | USA | Consumer Goods – Apparel | New York | 1/12/2011 | 141.54 | 2/3/2018 | Low trading volume |
|
00805 |
Glencore plc | Switzerland | Materials – Commodities | London | 25/5/2011 | 3.716 | 31/1/2018 | Low portion of shares on the HK Register |
|
00847 |
KAZ Minerals PLC | Kazakhstan | Materials – Mining | London | 29/6/2011 | 88.64 | 1/8/2018 |
Low portion of shares on the HK Register |
| 01021 | Midas Holdings Ltd | China | Materials – Alloy Manufacturing | Singapore | 6/10/2010 | 6.43 | 1/8/2018 |
Insolvent: liquidated |
| 01878 | SouthGobi Resources Ltd | Mongolia | Energy – Coal Mining | Toronto | 29/1/2010 | 20.36 |
|
|
| 06488 | SBI Holdings, Inc | Japan | Financials – Securities, AM | Tokyo / Osaka | 14/4/2011 | 17.405 | 25/6/2014 |
Low trading volume |
|
06210 |
Vale S.A. | Brazil | Materials – Mining | Brazil / New York | 8/12/2010 | 1337 | 28/7/2016 | Low trading volume |
| 00945 | Manulife Financial Corporation | Canada | Financials – Insurance | Toronto | 27/9/1999 | 46.464 |
|
|
Source: HKEX, Bloomberg
WHY DID THOU REJECT OR RETURN?
The Exchange published its annual listing decision on applications that it rejected and returned in the past year. The primary cause for rejection is as follows:
Table 2: Reasons for rejection of IPO application
|
Cause for Rejection |
No. Applications |
|
Commercial Rationale |
16 |
|
Valuation |
4 |
| Suitability of Director / Person with substantial influence |
1 |
| Profit Requirement |
1 |
Source: HKEX-GL126-2020
The Exchange continues its practice to vet the commercial rationale for listing as the main factor in determining suitability. The question on valuation of the business usually rides on the back of the commercial rationale concerns. Based on the drafting of the rejection listing decision, it appears the failure to meet the profit requirement stems from a lack of understanding of the Listing Rules. These rejection highlights the importance of careful homework, planning and independent advice on the part of these companies that would have saved them a lot of money and heartache.
The Exchange highlighted two returned applications last year and provided more guidance on the inclusion of financial information rule on the application process which may suggest a substantial number of applications were returned as it fell afoul of this rule. For simplicity, we provided a tabular version of the guidance.
Table 3: Financial Performance disclosure requirements
|
Application Date |
Company Year End | Must listing by (MB) | Must listing by (GEM) | Financial performance disclosures in the Application Proof (Main Board) | Financial performance disclosures in the Application Proof (GEM) | Financial performance disclosures in the Prospectus (Main Board) | Financial performance disclosures in the Prospectus (GEM) | Other Conditions |
|
Between 1 January 2020 and 29 February 2020 |
31-Dec-19 | No later than 31 March 2020 | No later than 29 February 2020 | 2017, 2018, 9M2019 | 2018, 9M2019 | 2017, 2018, 2019 | 2018, 2019 | HKEX-GL56-13, HKEX-GL25-11 |
|
Between 1 March 2020 and 30 June 2020 |
31-Dec-19 | 2017, 2018, 2019 | 2018, 2019 | 2017, 2018, 2019 | 2018, 2019 |
HKEX-GL56-13 |
||
| Between 1 July 2020 and 31 August 2020 | 31-Dec-19 | 2017, 2018, 2019, 3M2020 | 2018, 2019, 3M2020 | 2017, 2018, 2019, 3M2020 | 2018, 2019, 3M2020 |
HKEX-GL56-13 |
||
| Between 1 September 2020 and 31 December 2020 | 31-Dec-19 | 2017, 2018, 2019, 6M2020 / 9M2020* | 2017, 2018, 2019, 6M2020 / 9M2021* | 2017, 2018, 2019, 6M2020 / 9M2020* | 2017, 2018, 2019, 6M2020 / 9M2021* |
HKEX-GL56-13 |
* Depending on availability
Source: HKEX-GL127-2020, HKEX-GL56-13, HKEX-GL25-11
Although this appears to be a simple guidance to follow, there were media reports of a large biotechnology company that, was listed earlier this year, had its initial application for IPO returned because it did not adhere the guidance above.
Odyssey Corporate Advisory is a boutique corporate advisor providing independent and impartial investment and capital markets consultancy services catered for your circumstances and preferences. Corporate Advisory is a division of Odyssey Asset Management Ltd, a Type 1, 4 and 9 SFC licensed company and subsidiary of the Odyssey Group. If you have any enquiries, please contact:

Kuan Yu Oh
Managing Director, Co-Head of Corporate Advisory
Mobile: +852 6971-7989
Email: kuanyu.oh@odysseycapital-group.com
Notice
This publication is for informational purposes only and does not address the circumstances of any particular individual or entity. It does not constitute financial advice and should not be used as such. You should seek a duly licensed professional for investment advice. For more information about please see our Disclaimer.


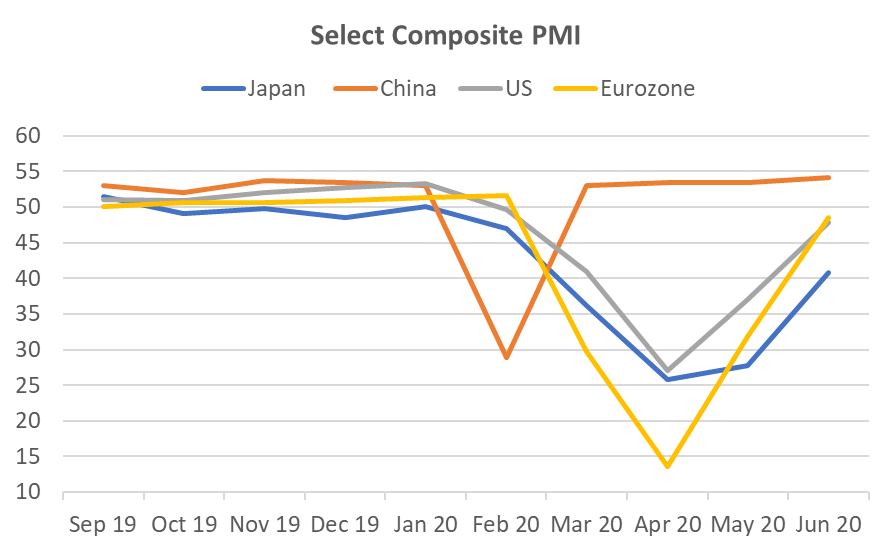 Source: Bloomberg
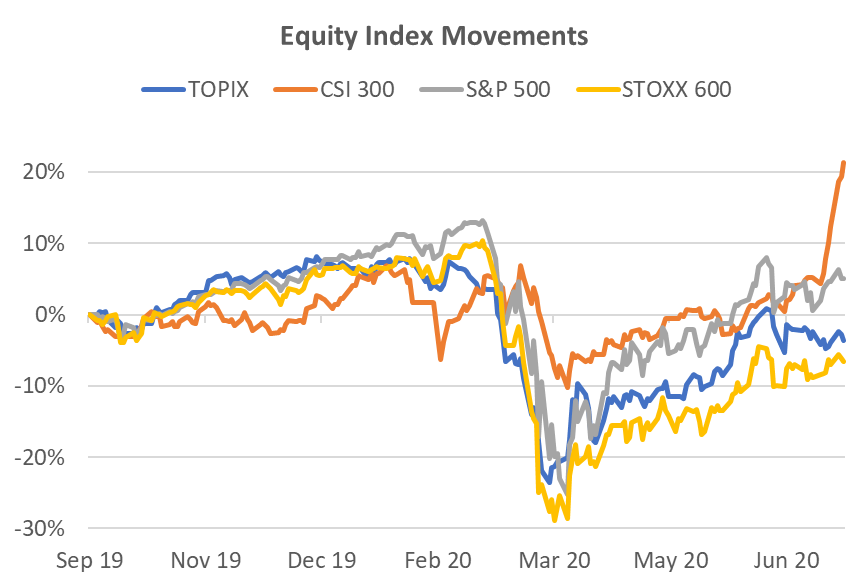 Source: Bloomberg
 Source: Bloomberg