
May 15, 2020 | Careers
Odyssey Group is Asian’ leading independent Alternative Asset Manager. We are currently expanding its External Asset Management (EAM) Platform and are actively inviting experienced Private Bankers and Wealth Managers to join this market leading platform.
ROLE SUMMARY
You will be responsible for bringing in new accounts and developing AUM. Cross-selling a wide range of private banking and wealth management products and solutions to clients will be part of your core responsibilities.
Private Client Advisers at Odyssey develop deep client relationships in order to thoroughly understand the client’s situation and utilise that knowledge to develop tailored wealth management strategies. The Advisers are able to add value to individual and corporate clients by building and drawing upon a network of internal resources, often global, to achieve desired results. Successful Advisers are able to develop and adapt a disciplined sales process to convert a pipeline of prospects into target market clients. In addition, they are able to deliver quality client relationships (solutions and services) in an intensely competitive fragmented market, taking advantage of the Odyssey platform while protecting the client/firm by complying with relevant policies, procedures, and country legal/regulatory requirements.
Markets covered: Greater China – Hong Kong, China, Taiwan.
The ideal candidate is an existing private banker and has at least 60%-70% of his/her key clients domiciled in the countries covered. Other candidates and client coverage may be considered.
ROLE REQUIREMENTS
New Client and Business Development
- Grow client net revenue annually in core product areas: investment management, capital markets, real estate, and banking & lending.
- Create sales and marketing strategies designed to generate revenue growth and to acquire new target clients within different sectors.
- Prospecting – generate leads and develop prospects, network to identify referrals to new clients/prospects.
- Profile, qualify, and convert prospects into clients.
- Identify and execute on new business opportunities with existing clients.
- Orchestrate appropriate specialist resources to develop tailored, long-term solutions for clients/prospects.
- Present and communicate to clients/prospects complex financial concepts and investment strategies in a way that is easily understood.
Relationship Management
- Serve as the client’s advocate and trusted advisor (primary contact) for strategic advice on financial matters.
- Create, organise, and implement a wealth management strategy designed to deepen relationships with existing clients.
- Manage client expectations regarding service and deliverables.
- Ensure financial strategies are kept current and appropriately aligned with client objectives.
- Understand and communicate the risk involved with financial and investment strategies.
- Ensure all client inquiries and problems are handled effectively and resolved.
- Help team members to acquire experience and establish credibility with clients.
Compliance Oversight and Controls
- Comply with all regulatory policies and control procedures regarding client transactions and suitability.
- Oversee and ensure clients are on-boarded appropriately including all required documentation is complete and accurate.
Experience
- 3 to 5 years minimum industry experience.
- Established client base with existing AUM.
Qualifications
- SFC licensed.
- CWM or other designation a plus.
Languages
- English, Mandarin (preferred), Cantonese (preferred).
Roles Details
- Primary Location: Hong Kong
- Schedule: Full-time
- Education Level: Bachelor’s Degree or higher
YOUR BENEFITS
- Flexible
- Better Economics
- Tailored Fees
- Equity Participation
- Full Support
- Investment Advisory Desk
- Deal Flow
- Tactical Ideas
- Unrestricted View
- Large Range of Providers
- Independent
- Scale
- Fun Culture
YOUR CLIENT BENEFITS
- Competitive Pricing
- Broader Access
- Research
- Buy Ideas
- Discretionary Portfolios
- Investment Advisory
- VIP Client Events
PRODUCTS
- Discretionary Portfolio Service
- Bespoke Portfolio Mandates
- IPO Allocations & New Bond Issues
- Real Estate Opportunities
- Co-Investment Opportunities
- Differentiated Investment Funds
- Mortgages
- Insurance Solutions
- Institutional Solutions
PLATFORM FEATURES
- Open Architecture, Access & Pricing
- Full Product Suite including Credit Facilities
- 24 hours Trading Platform
- Online Access
- Investment Advisory Desk
- Research Desk
- Multi Valuation “Balance Sheet” Solution
- Full front, Middle and Back Office Support
If you would like to apply for the role, or have questions, contact us here.
WHO ARE ODYSSEY
Odyssey Capital Group Ltd is Asia’s leading independent Alternative Asset Manager that provides differentiated and bespoke investment solutions across multiple asset classes. We aim to only employ the highest quality people as partners in our business, while pursuing the highest standards, and aligning our interests with those of our investment partners. It is our mantra to be the “trusted partner” for our clients’ needs.
Odyssey’s sister business, Odyssey Asset Management Ltd is a SFC Type 1, 4 & 9 licensed company, who offers the most entrepreneurial and full service External Asset Manager (EAM) platform in Asia. The EAM platform allows experienced Private Bankers and Wealth Management exclusive access to an independent and comprehensive platform that allows them to offer a range of market leading solutions in order to address all of their client’s needs.
WHAT DO WE DO
Our EAM platform allows experienced Private Bankers with established client bases to transform from being employees to being business owners, in turn securing their financial future. Odyssey takes care of the day to day administrative tasks to allow you to focus on servicing your clients and addressing all their investment, wealth, tax and planning needs. At Odyssey clients come first, hence we are constantly seeking ways we can create value for you and your clients. You can find more details on our website here: http://www.odysseycapital-group.com/external-asset-management-platform/

May 15, 2020 | Articles, Global Markets Update
Lex Capitis Odyssey Corporate Advisory’s periodical that highlights capital and financial markets developments and its potential implications for you and your business.
Odyssey Corporate Advisory is an independent boutique consultant providing business advisory, investment consultancy, project management and coordination services for companies that intend to access the Hong Kong capital markets.
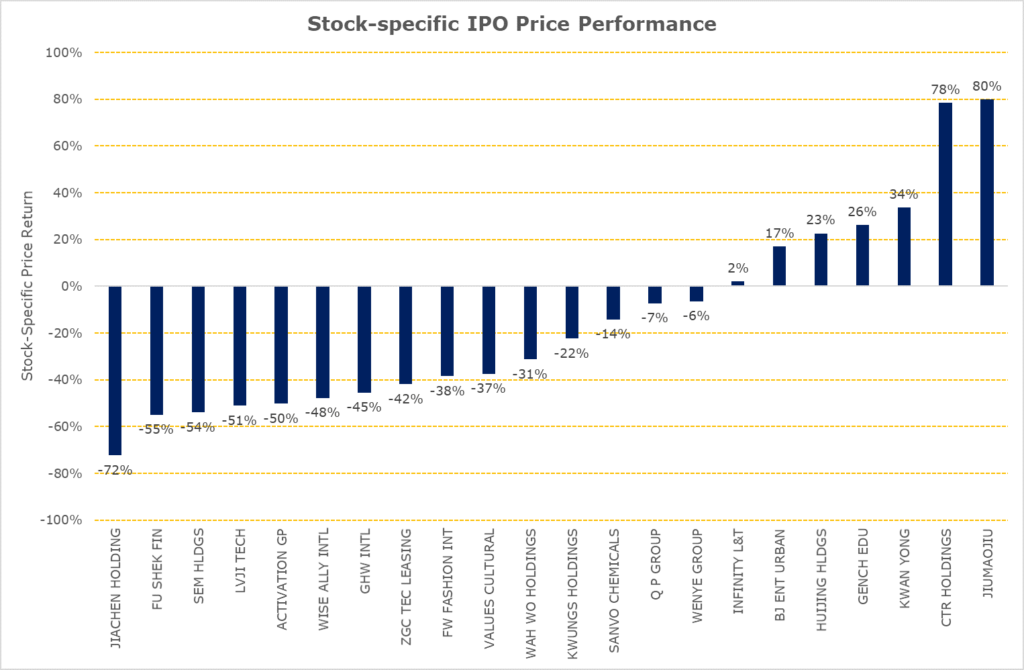
Searching for Diamonds in the Rough
Source: Bloomberg, Odyssey Capital
Summary:
- IPOs of Singapore and Malaysia companies during the two months of 2020 have outperformed the market;
- The price-performance of IPOs with cornerstone investors, on average, performed better than IPOs that did not have cornerstone investors during this period. However, stock-specific factors in each IPO were the key determinant in price performance;
- Size matters, on average, during this period as IPO with a market capitalisation that is greater than HK$1 billion performed, on average, better than IPOs market capitalisation less than HK$500 million. However, stock-specific factors in each IPO drove the disparity in price performance.
IPOs during January and February 2020
During the first two months of 2020, 24 companies listed on the Stock Exchange of Hong Kong. 22 companies were listed on the Main Board and two companies on GEM. There was no one particular industry that dominated, with companies ranging from the construction to television industries. Four IPOs (Wenye Group, Wah Wo Holdings, Jiachen Holdings and China Hongguang Holdings) were undersubscribed in their placing offer and one IPO (HuiJing Holdings) was undersubscribed on the public offer.
| Geography |
Board of listing |
No. of IPOs |
Average returns of IPOs |
Average returns of IPOs adjusted by HSSI returns |
| China |
Main Board |
17 |
-27% |
-19% |
| Hong Kong |
Main Board |
3 |
-38% |
-31% |
| Macau |
Main Board |
1 |
-57% |
-54% |
| Singapore |
Main Board |
2 |
43% |
56% |
| Malaysia |
Main Board |
1 |
-6% |
2% |
|
|
|
|
|
| China |
GEM |
2 |
-37% |
-30% |
Figure 1: Average IPO returns
Source: Bloomberg
Given the current market environment, we examined the stock-specific returns from their IPO date to 29 April 2020 by adjusting each IPO’s price-performance by the price return of the Hang Seng Composite Small Cap Index (“HSSI”). The HSSI is the appropriate market proxy because the IPO market capitalisation of the companies during this period ranged HK$500 million to HK$10,140 million which is within the scope of HSSI’s constituents market capitalisation. Contrary to an earlier media report about the unattractiveness of South-East Asian companies listing in Hong Kong, investors would, on average, have benefitted from investing Malaysian and Singaporean companies that IPO during this period.
Time to Listing
| Longest application days |
345 |
| Average application days |
198 |
| Shortest application days |
119 |
Figure 2: Timing from application to allotment of Shares
Source: Odyssey Capital
There was no change in the time required for the listing process, the average time from submission of the IPO application until the allotment of shares took more than six months, i.e. it required at least one renewal of the IPO application. The IPO that took the longest was almost a year whilst the shortest took just under four months. There was no discernible difference in the time required between main board applications and GEM board applications.
Size Matters?
| Stock Code |
Name |
IPO Market Capitalisation (HKD Millions) |
IPO returns adjusted by HSSI returns |
| 09968.HK |
HUIJING HLDGS |
10,140 |
23% |
| 09922.HK |
JIUMAOJIU |
9,131 |
80% |
| 01745.HK |
LVJI TECH |
2,990 |
-51% |
| 01525.HK |
GENCH EDU |
2,511 |
26% |
| 03718.HK |
BJ ENT URBAN |
2,484 |
17% |
| 09919.HK |
ACTIVATION GP |
1,616 |
-50% |
| Average Stock-specific IPO Price Performance (Market Capitalisation greater than HK$1,000 million) |
7% |
Figure 3: Large IPOs
Source: Bloomberg
| Stock Code |
Name |
IPO Market Capitalisation (HKD Millions) |
IPO returns adjusted by HSSI returns |
| 02528.HK |
FW FASHION INT |
800 |
-38% |
| 01802.HK |
WENYE GROUP |
630 |
-6% |
| 01412.HK |
Q P GROUP |
628 |
-7% |
| 01442.HK |
INFINITY L&T |
620 |
2% |
| 00301.HK |
SANVO CHEMICALS |
556 |
-14% |
| 01937.HK |
JIACHEN HOLDING |
530 |
-72% |
| 09998.HK |
KWAN YONG |
520 |
34% |
| 01740.HK |
VALUES CULTURAL |
519 |
-37% |
| 01925.HK |
KWUNGS HOLDINGS |
518 |
-22% |
| 09933.HK |
GHW INTL |
510 |
-45% |
| 01601.HK |
ZGC TEC LEASING |
507 |
-42% |
| 01416.HK |
CTR HOLDINGS |
504 |
78% |
| 02263.HK |
FU SHEK FIN |
500 |
-55% |
| 09929.HK |
SEM HLDGS |
500 |
-54% |
| 09918.HK |
WISE ALLY INTL |
500 |
-48% |
| 09938.HK |
WAH WO HOLDINGS |
500 |
-31% |
| 08500.HK |
ICONCULTURE |
250 |
-48% |
| 08646.HK |
CHINA HONGGUANG |
231 |
-13% |
| Average Stock-specific IPO Price Performance (Market Capitalisation less than HK$1,000 million) |
-23% |
Figure 4: Small IPOs
Source: Bloomberg
Although on average, IPOs with a market capitalisation greater than HK$1,000 million performed better than IPOs with a market capitalisation less than HK$1,000 million, there was a wide disparity in price-performance between IPOs. Compared to LVJI Technology Holdings and Activation Group Holdings, 12 small IPOs had smaller negative returns. CTR Holdings and Kwan Yong Holdings had better returns compared to Huijing Holdings which was the largest IPO for the period.
Odyssey Corporate Advisory is a boutique corporate advisor providing independent and impartial investment and capital markets consulting services catered for your circumstances and preferences. Corporate Advisory is a division of Odyssey Asset Management Ltd, a Type 1, 4 and 9 SFC licensed company and subsidiary of the Odyssey Group. If you have any enquiries, please contact:

Kuan Yu Oh
Managing Director, Co-Head of Corporate Advisory
Mobile: +852 6971-7989
Email: kuanyu.oh@odysseycapital-group.com
Notice
This publication is for informational purposes only and does not address the circumstances of any particular individual or entity. It does not constitute financial advice and should not be used as such. You should seek a duly licensed professional for financial advice. For more information about please see our Disclaimer.

May 13, 2020 | Articles, Global Markets Update
Market View
The equity markets have been buoyant for the last 6 weeks. Global virus cases have peaked and many countries have started a tentative process of loosening lockdown restrictions. To assist the recovery, G20 countries have announced a stimulus program that is equivalent to 9.3% of combined GDP, notably supported by close to zero interest rates. This level of stimulus is unprecedented.
On the other hand, we have almost total cessation of activity in very large swathes of the global economy, particularly in the service industries that constitute 65%-75% of GDP for Europe and the US. This sector employs a similar level of the workforce. US unemployment has already reached 14.7% with a 2% lower participation rate. Unemployment rates in the US and Europe are expected to peak in Q2 with significant recovery by year end. Whether the current valuations of the equity market are justified depends on the speed at which lockdown measures are removed and how rapidly the global economy normalizes.
In the last three recessions, it has taken an average of approximately 4 years for earnings per share and the unemployment rate to reach the previous peak. This is clearly not what the market is expecting with the huge stimulus in place. The 2021 estimated PER for the S&P 500 is close to 18x, approximating the highest level for the last 5 years and a level that hasn’t been breached since the Dotcom boom, twenty years ago.
Muddying the situation is that famous brands that are weathering the lockdown well are at all-time high two year forward PERs. We all know of the usual suspects that have benefited from the lockdowns such as Netflix and other online businesses, as well as pharmaceutical companies share that have skyrocketed due to their work on a vaccine. However, some of the largest consumer discretionary companies that have been negatively affected by the virus, but are expected to bounce back strongly, are also at highly elevated valuations. This is in contrast to those businesses seen as the most vulnerable to the virus where valuations have plummeted. Unlike previous deep recessions, the high-quality businesses you want to own for the long term never really became cheap. As Warren Buffet recently lamented “we don’t see anything attractive to do”.
We have entered the statistically weaker May-Oct period for equity markets. So far, sentiment has been buoyant due to prospect of lockdown restrictions loosening. The market is like a prisoner getting excited at the prospect of getting out of jail. However, once we are out, reality will set in and the hard slog of getting back into a normal life begins. There will be times when we wonder why we were so excited, and for many, finding a job in the real world will be very difficult for some time.
The US market bounce from the bottom has been rapid. From its March 23 trough, the S&P 500 has taken just 26 days to regain 60% of its previous peak after the 34% fall. Following the 2008 GFC, it took 373 days to reach this level of recovery. Perhaps, this is a tough comparison since the market fell 57%. The closest in terms of peak to trough fall and the speed of the fall was the 1987 Crash when the market fell 33% in the space of days, but then it took 469 days to recover 60%. The fastest recovery before the current situation is the 1990-91 recession. Here, the peak to trough was only 20%, but the 60% recovery was reached in 111 days. The market appears to be expecting that the huge stimulus package, zero interest rates, and the fact that this recession was caused by government actions specific to the Coronavirus and therefore, can be undone by the reversal of those policies, to be the game changers.

Figure 1: Market Crash Comparison Source: Bloomberg, Odyssey Capital
Where is the Value?
The speed of the equity bounce was a surprise. What should not have been a surprise was the transient nature of the huge spike in equity volatility, the level of which rivalled the GFC. That was an excellent time to be short equity volatility in structured products where you were overly compensated for risk. Now that the volatility opportunity has faded, what are the current opportunities?
On a relative basis, valuations for Asian and European equity indices are close to their nadir relative to the US. While European equities show the same symptoms as the US market where resilient quality businesses are priced very expensively, the same characteristic does not appear as prevalent in Asia. For the latter there are still quite a few quality businesses we’d like to own for the long term on historically modest valuations.
By asset class we still prefer fixed income. While the US investment grade indices are already back to where they were at the beginning of the year, BBB spreads remain close to 100bp wider. US high yield (HY) is still trading at a wide credit spread of 720bp, implying a 5yr default rate of approximately 50%. Since the majority of US HY bonds are issued by listed companies, what does it say about the equity value of those companies? What many equity investors may forget is that there is contractual obligation for a company to repay that bond and the interest, and if they do not pay, bondholders can force a liquidation of the company. In such a case, equity holders rank last to receive money, if there is any left. Often, there is not. This payment ranking system is the reason why in a crisis situation corporate credit generally outperforms equity by a wide margin. However, in the last couple of weeks, equity has roared ahead while bond spreads have remained stagnant. This suggests there is a disparity between the corporate risks that bondholders perceive, particularly for high yield, and those that equity holders perceive.
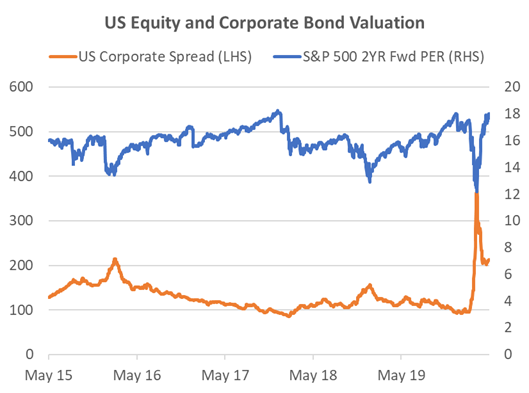
Figure 2: US Equity and Corporate Bond Valuation Source: Bloomberg, Odyssey Capital
In alternatives we also note that some managers are creating new funds to take advantage of the current dislocation in markets, particularly in the private credit space. These provide significant interest. However, we remain a little cautious of ongoing vehicles that have yet to mark down their investments to account for the current business environment. Private investment valuations often show little correlation to the public markets. The only time that changes is when the real economy is affected significantly. Then the correlation is very high, even though it is revealed on a lagged basis.
If you like to receive more information on our portfolios solutions, please contact us here: info@odysseycapital-group.com