Market Update: November 2018
Despite the month-end window dressing, October was a bad month for equities.
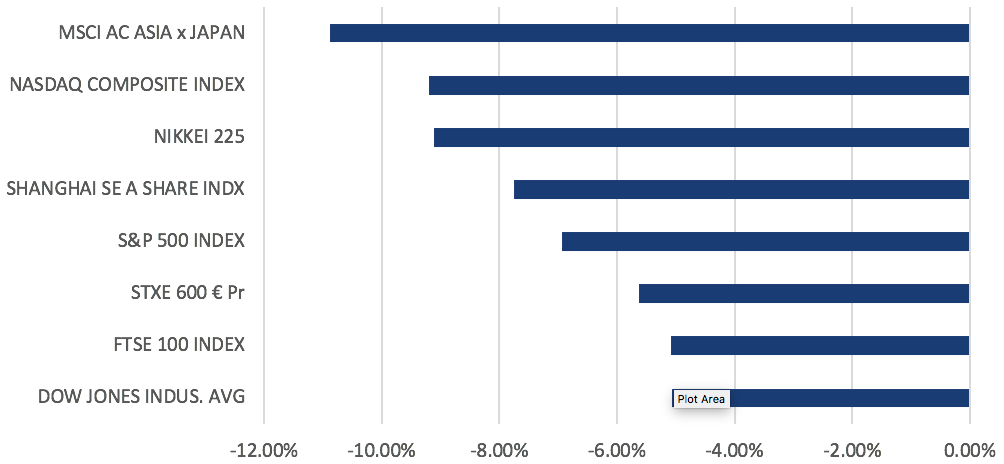
Indices in the major regions all closed significantly lower within the range of -5% to -11%, with MSCI AXJ leading declines (Figure 1). This month was also the worst October since ’08, where indices fell in the ranges of -13% to -25%. Markets were risk-off for most of the month, causing a rotation into defensives like Utilities and Consumer Staples in the S&P 500. A similar trend was seen in Stoxx 600, with the F&B, Utilities and Telecomm Services losing the least over the month.
Figure 1: October returns across major indices
Geopolitics and trade concerns continued to weigh in October, starting with the EU formally rejecting Italy’s budget plans, which led to BTP 10Y yields whipsaw around 3.5% while the spread over Bund yields rose to a high of 327bps during the month. Merkel’s decision to not run for re-election as chairman of the CDU in December also renewed political uncertainty in the region and weighed on the EUR. Trade tensions between US and China seemed to improve toward the month-end (and markets took it as such), despite Trump’s threats to levy all remaining Chinese imports if talks with Xi later this month fail.
Corporate earnings were also the focus of this month, as companies are midway through reporting Q3 earnings. As of last week, 74% of companies in the S&P 500 have reported earnings. 78% of these companies have reported earnings beat, while on aggregate, companies are reporting earnings that are 6.8% above the estimates. We saw weaker earnings from US IT stocks like Amazon, Alphabet and Apple, that resulted in overnight losses of c. 4% – 7% while disappointing earnings outlook from industrial bellwethers like Caterpillar and 3M raised concerns around the global growth outlook.
Our base case is founded on the need for an ability to look across the valley as the short-term may see further downside from:
- A possible deterioration of Sino-US relations, with risk that China retaliates via non-trade means such as CNY devaluation etc;
- Weaker EPS outlook and potential Q3 earnings misses – most likely from companies in Asia ex-Japan;
- Cyclical peak in US GDP growth;
- Rising geopolitical risks – notably in Middle East (ME);
- US tariffs on global auto imports; and
- Italy’s budget deficit;
In the medium-term, solid EPS growth in the low double-digits and positive global GDP growth data still underpin the fundamental case for equities. The negatives in the ‘noise’ should not derail EPS or GDP growth but might reduce, on the margin, a more aggressive Fed rate hike cycle for longer. This suggests that the recent correction in equities is one to be adding into selectively, in a disciplined manner.
We think it is highly likely any evidence of a GDP slowdown in 2019 will be met by increased fiscal spending and greater monetary policy gradualism. Rising rates are a risk, but rates are well below levels that have historically disrupted a positive equity trend. In addition, valuations for non-US equities are reasonable and real estate owned recoveries are underway. Even in the US, equity valuations, excluding IT, SMEs and parts of the consumer discretionary/healthcare sectors, are not overly stretched.
As it is almost impossible to finesse market bottoms, we think the only approach has to be to stay the course with relatively defensive positioning and look to become more risk-on as we cross the valley, by being disciplined in adding into further declines while risk managing portfolios, should a rebound take place. Our assumptions are that we do not see a US/global recession in the next 12-18M; that oil prices – bar any Middle East ‘shocks’ – will not move appreciably higher than the mid 80s; and that concerns over global liquidity tightening are exaggerated.
Equities
- The S&P 500 lost 6.94% in October, while the tech heavy Nasdaq tumbled 9.20% for its biggest monthly fall since Nov ’08, while the Dow Jones fell by 5.07%. The falls sent the U.S. into ‘correction’ territory, despite a decent earnings season for the companies that have reported, and strong macroeconomic data.
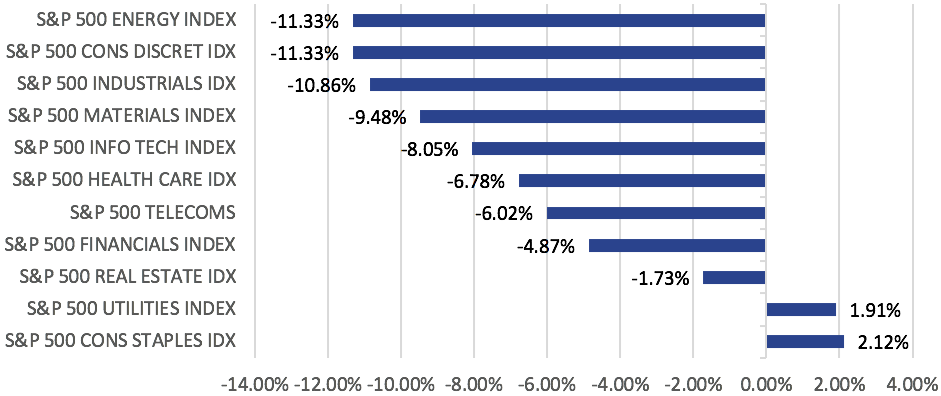
Figure 2: S&P 500 Sector Performance in October
- The month saw further evidence of sector rotation, with defensives in the S&P 500, namely Utilities (+1.91%) and Consumer Staples (+2.12%) holding up while Consumer Discretionary (-11.33%), Energy (-11.33%) and Industrials (-11.33%) led declines (Figure 2).
- With U.S. equity markets starting to look choppy, we continue to emphasize last month’s call that late cycle and slowing earnings growth suggest defensive sectors may outperform – there is increasing evidence that this sector rotation is happening, along with value outperforming growth by over 3% this month.
- Additionally, the outcome of the U.S. mid-term elections has the Democrats take control of the HoR, while the GOP retains control of the Senate. This result is neutral to slightly positive for U.S. equities.
- In-line with the global equity rout, STOXX 600 fell -5.63% for the month and saw broad-based losses across all sectors except for Telecommunications (+0.01%), which barely ended the month flat. The FTSE 100 was also lower on the month, losing -5.09%.
- The EU summit earlier in the month also brought the spotlight back on to Brexit, and the conflict between Rome and Brussels over Italy’s proposed fiscal budget deficit. On both scenarios, our base case remains that a compromise will be reached by the respective deadlines. On Brexit, the outcome will also depend on whether May is able to get the votes in Parliament.
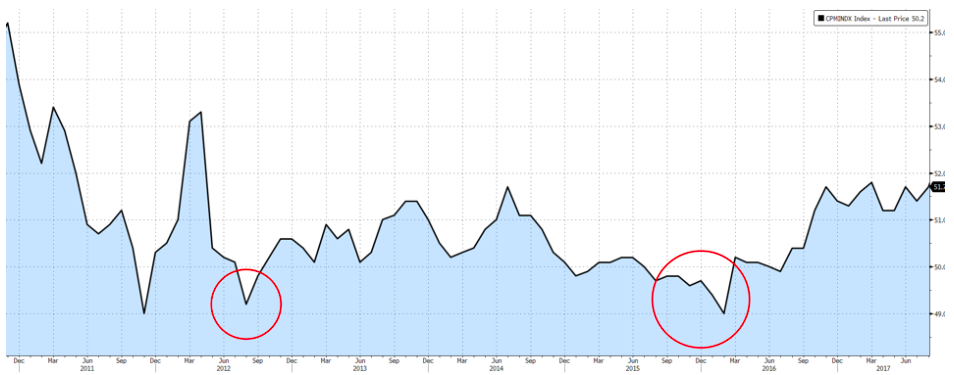
Figure 3: China’s Official PMI
- China A-shares extended losses to an intra-month low of -12%, after which a slew of new government policies and renewed optimism on the trade scenario with the U.S. helped lift sentiment on the index to close -7.75% lower for the month. While PMI weakness continued in October, it still remains far from levels that would warrant cause for concern, which would be somewhere closer to the lows witnessed between ’12 to ’16 (Figure 3). Interestingly, these were addressed through similar waves of stimulus policies which we see today – commitments to boost growth, stabilize employment, finance, external trade, foreign investments and supporting private enterprises. .
- Overall, our view is that the situation for Chinese markets is far from the pessimism that it has experienced, and while growth expectations have inadvertently dampened, the willingness to be flexible in amending interventionist policies and drastic measures to protect the economy are encouraging.
- While there is value support for EM equities more broadly, there is also merit in being patient as the US still has an option to extend tariffs on all Chinese imports, and will likely raise them to 25% by the end of the year which will worsen Sino-US relations. There is also a genuine risk that China will allow the CNY to weaken past 7, which EM Asia would struggle with.
Fixed-Income

Figure 4: UST 10Y yield reaches fresh 7Y highs and testing 3.2%
- Positive economic data in September supported US growth in Q3, pushing UST 10Y yield to a fresh 7Y high (Figure 4) of 3.233% early in the month. However, risk-off sentiments from the equity selloff late in the month led to increased demand for safe haven assets, causing the UST 10Y yield to fall back down, ending the month just 8.23bps higher at 3.144%.
- Corporate debt also underperformed sovereigns over the month, with High Yield (HY) debt losing the most. Global HY spreads increased 43.59bps, while US HY spreads increased 55bps, with the asset class losing 1.6% MoM. US bond funds saw net outflows of more than $13bn, relative to $3.8bn in EM debt funds.
- US economic data released over the month is unlikely to change the Fed’s decision to raise rates in December. JP Morgan expects UST yields to rise steadily into late ’19 as they think the Fed will probably hike rates every quarter through to the end of next year. In addition, the US Treasury is expecting to issue $425bn worth of USTs in 18Q4, bringing the total borrowing this year to $1.34tn, more than double of that in ’17. This increased supply, along with the Fed reducing its balance sheet, could put further pressure on UST yields to rise.
- The risks to longer duration FI remain high, be it technical supply issues, an inflation ‘shock’ (PCE data saw PCE inflation continue to rise while private sector wages rose at a 5% YoY pace) or even China dumping its USTs. We continue to think allocations to longer duration, high quality FI makes little strategical sense bar a short-term tactical trade, and remain in favour of shorter duration, lower credit quality FI despite the higher risk and more probable refinancing issues, especially for weaker Chinese property companies.
Currencies
- USD was stronger in October, with the DXY gaining 2.10% on the back of strong economic data and having its ‘safe haven’ features tested when trade tensions were on the rise. Aside from USD strength, DXY was also supported by weakness in GBP and EUR (accounting for 70% of the index) from Brexit and Italian concerns. The two key events this month that will likely move the USD are 1) the US mid-term elections, and 2) Trump and Xi’s meeting at the end of the month.
- There is increasing downside risk for the EUR after testing 1.13, a key support level, twice in October. We see a renewed layer of political uncertainty with Merkel’s decision not to seek re-election as leader of CDU in ’21, while Italy’s proposed budget deficit continues to weigh on EUR sentiment. Should the EUR break its support of 1.13, we may see 1.10 as the next possible support. If 1.13 holds, we can expect to see a new range between 1.13 to a familiar resistance of 1.18.
- It was also a troubling month for Asia ex-Japan currencies, with CNY leading other currencies lower. Higher oil prices and rising rates were not supportive either, particularly for the INR and IDR. China released a stream of mixed data with improvements in consumer spending but unsurprisingly soft industrial data. 7.0 remains a strong support for USDCNY.
Commodities
- Brent ended c. 16% lower from a recent high of $86.29 on a mix of slowing industrial data from trade wars and OPEC boosting its production to its highest levels since 2016 causing Brent to break below its 200DMA ($73.98) on the 1st of Nov. Oil has remained above its 200DMA since September 2017. The higher output has since replaced the tight supply sentiment.
- Gold is finally coming off from its floor of 1200 as the risk-off in equity markets led to some looking to the precious metal as a safe haven asset, and the technical show that 1215 is now a resistance-turned-support.
- Sanctions on Iran kicked in on the 5th of November, but the waivers issued to 8 countries are likely to offset some if not most of the supply-side impacts on the global oil market. The waivers also reduce the probability of Iran blocking the Straits of Hormuz, which has taken away some of the geopolitical risk premium that we have seen in oil prices over the past few months.
- At present, we still remain bullish on oil (and energy, more generally), on the basis that demand still remains strong, against a backdrop of weak capex over the past few years which will eventually result in a structural shortage on the supply side.
CONTACT
We would be more than happy to have an informal chat about these and the other services we offer as well as the current opportunities we are looking at.