
Market Update: October 2019
Markets saw a risk-on rotation in September (Figure 1) amid positive trade developments earlier in the month. China suspended tariffs on 16 types of US products, while the USA delayed tariff hikes from 1st October to 15th October in order to avoid China’s 70th anniversary. On top of the 16 products, China also talked about removing tariffs on bigger ticket items like soybeans and pork and have reportedly started making big purchases of those items. This led the S&P 500 back near an all-time high, while sovereign debt and high-quality corporate debt ended the month lower, with US Treasury (UST) 2Y and 10Y yields paring most of the losses seen in August.
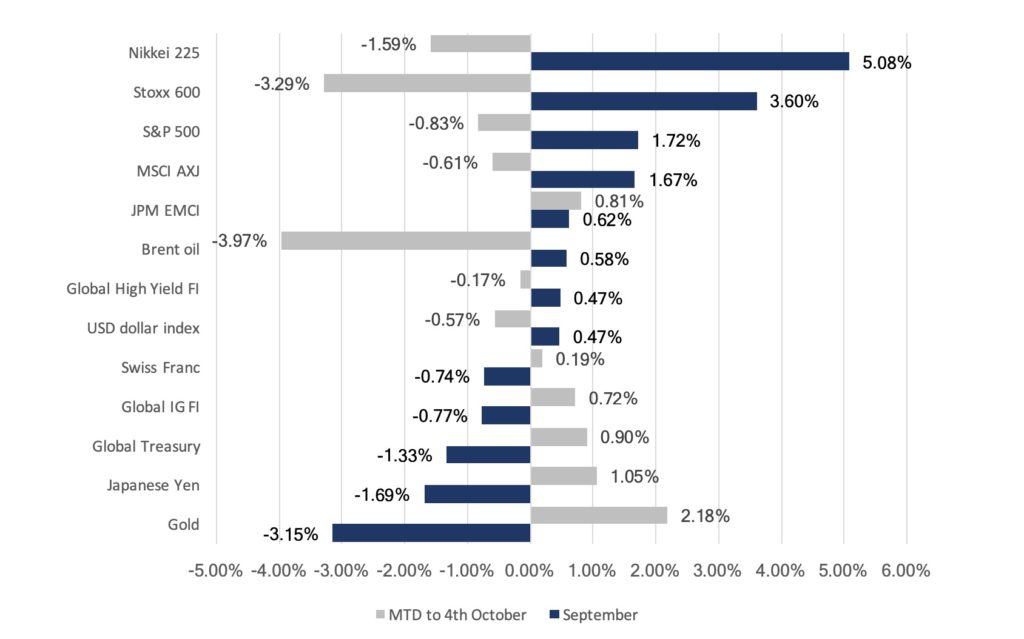
Fig 1: Risk-on rotation sees outflows from haven assets. Source: Bloomberg
However, there remain challenges in negotiations. Reports that the White House was considering limiting capital flows from US to China surfaced at the end of the month. The reports hit markets negatively though those were quickly denied by US officials. In addition, Chinese officials mentioned over the weekend that they are now less willing to agree to the kind of broad trade deal that Trump is seeking and are narrowing the number of topics to be discussed.
European equities also recovered across the month, supported by the ECB’s commitments to further erase monetary policy, with Stoxx recovering losses in August to trade at levels last seen in July. However, the WTO’s decision to allow US to impose tariffs on Europe given Europe’s illegal aircraft subsidies to Airbus saw Stoxx fall in the first week of October. Asian equities, on the other hand, were a mixed bag, though the MSCI Asia ex-Japan index managed to close higher.
However, global growth concerns resurfaced in the first week of October as data for September, particularly for the US, came in weaker than expected, causing a rotation back into safer assets, paring gains/losses seen last month (Figure 1).
FX remained relatively quiet across the month, with volatility remaining low. GBP saw one of the largest moves within the G10 group, apart from the move out of safe-haven currencies like JPY and CHF. The pound continues to be driven by Brexit headlines, gaining strength in September amid a series of developments that reduced the probability of a no-deal. However, the currency pared gains during the last week of the month after Boris Johnson called for early elections and Corbyn indicated he will call a vote of no-confidence after a Brexit deadline extension was secured.
Separately, the USD strengthened over the month, with DXY gaining 0.47%, underpinning the reality that USD remains the least ‘bad’ developed markets (DM) currency with the EU facing recession amid a divided European Central Bank (ECB), and the Bank of Japan (BOJ) hinting it will ease on the 31st October. The Swiss National Bank (SNB) has also been leaning toward a dovish tilt and that will ease the CHF. Likewise, emerging markets (EM) central banks were seen to be cutting rates – this includes India – whilst the People’s Bank of China (PBOC) effectively lowered rates 10bps via a new rate-setting benchmark and injecting liquidity to the system. This seems to suggest that we might see the dollar remain stronger for longer and that might potentially weigh on EM Asian currencies and thus equities likewise.
Oil prices saw increased volatility this month, driven by a drone attack on Saudi Arabia’s production plants. The Brent oil price spiked to $70 after the attack but quickly retraced to end the month lower. Saudi Arabis has since brought production levels back to levels seen before the attack. Prices were also pressured lower by concerns of a slowdown in global growth, accompanied by EIA and EIA data that showed increases in US crude inventory.
Outlook
Liu He and Lighthizer are reportedly set to meet (10th October). This comes just a week before the US is scheduled to increase tariffs on $250bn worth of Chinese goods to 30% from 25%. While both sides have exchanged small gestures of goodwill over the past few weeks, our view is that it does not circumvent the longer-term strategic confrontation between the two powers, and a wide gap on substantial issues – such as IP transfer rights and Xii’s “Made in China 2020” policy – that neither side is likely to back down on. Moreover, we have seen unprecedented bipartisan support in the US, and polls show that 80% of the US public see the need to address the issue. With that said, there is still room for a small deal to be cut in the near-term, and we do not think it would be wise betting against it. In addition, Trump’s latest ‘impeachment’ debacle and the allegations he pressured Ukraine’s leader to investigate Biden and sons are potentially damaging. The allegations could affect his re-election efforts and, as some might hope, his current role as President. We shall see – it would not be ‘out of character’ for Trump to turn even more erratic and throw a curveball in the way of trade negotiations as a distraction from domestic issues, whether or not that might be in favour of a deal.
However, moving away from geopolitics to the US economy, we think US macro data remains quite resilient but a weaker Conference Board consumer survey following the earlier disappointment in the University of Michigan’s consumer sentiment survey are early signs that there might be some weakness in this consumer-led economy. As we have noted before, the strong consumption dichotomy to weak corporate manufacturing and capital expenditure data will not be resolved one way or another, and the risk is that consumption weakens, adding to fears of a recession as quite possible and that equities will enter a bear market – they note the massive rotation of late-term momentum/growth sectors to value/cyclical’s preceded the last two recessions too. MS has called US markets reliably well in the last few years and often, rightly, been cautious about it too.
Brexit remains an overhang on Europe, and the immediate outlook seems dependent on whether Boris Johnson will be able to secure a deal with the European Commission (EC) at the European Union (EU) Summit on the 17th and 18th of October. Whilst Parliament has sensibly voted to not have a no-deal Brexit, Johnson is still committed to taking the UK out by the end of the month. We were delighted by the UK Supreme Court’s unanimous decision that Johnson’s prorogation move was unlawful (thus, in effect, saying he lied to the Queen). Boris was put into power by 93,000 votes (or 0.2% of the voting public) of which 75% were white males over 65 years old! Whilst 52% voted to leave, this accounted for 37% of those that could have voted and of that 52 %, not one was asked what type of Brexit was favoured. Democracy is failing the UK and it is now similar to a banana republic in the degree of volatility in policy action – with potentially damaging consequences – and instability in the country from what used to be a stable democracy with tramlines in terms of policy outlook. Whilst the Court’s decision is welcome – and GBP gained a big hit – the harsh reality remains the UK is in a mess over Brexit and the outlook is unclear. What ought to happen is either a fresh election (at this point it seems Labour’s policies and Corbyn make it unelectable plus, as a party more in favour to remain its route to victory is in marginal seats that voted to leave in ’16) or a 2nd referendum and we struggle to see where the upside for GBP is, whereas we see reasons for it to retest recent lows since the Brexit vote in ’16. A no-deal Brexit would be painful, and stupid, but over time this can be corrected whereas Labour’s policies are disastrous if implemented given the leadership is Marxist Cabal.
There is – in our view – a structural risk around oil that is potentially far earlier than peak oil which some see as soon as ’25. The Economist rightly notes that there is a (major) risk that the climate change impact could ‘force’ far more hostile regulatory action by governments that would impact oil companies hard. One consultancy sees such action happening within the next 2-3 years. This throws open the question about whether to hold oil stocks at all given these risks. We have some sympathy with this argument and realise that climate change is something we need to get on top of.
On the other hand, gold is ‘swinging’ around but has not followed falling UST yields higher lately and is trading in the $1,480-1,520/Oz range after bottoming out at about $1,463/Oz (prior 6y high) spike lower MTD. We remain an owner of gold in portfolios at a 3-5% weighting as a portfolio diversifier, an alternative ‘safe haven’ asset to sovereign FI and as a play on negative-yielding global FI (now at about $17tn or 30% of all FI). It is worth noting that central banks are a far larger, consistent buyer of gold for reserves than in the past – China added 5% to its already considerable reserves in the last 12M – in order to diversify from an over-reliance on USD as trade becomes less certain.
Despite all the negatives out there, equities (especially in the US) have stayed remarkably resilient YTD, and the with S&P 500 and MSCI ACWI just off all-time highs, it partly reflects the fact there is no alternative with over $15tn of negative-yielding FI and a large chunk of the rest offering negative real rates. It is worth noting that if you take the UST 10Y yield at about 1.6% relative to the S&P 500’s yield and compound that at 3% growth p.a. on just income over 10Y, the S&P 500 is yielding more than double that of UST’s, and one could argue that the S&P 500 is a safer bet than UST’s too!
Separately, the recent failure of WeWork to access public markets given the degree of skepticism around its business model is another illustration that private equity (PE) is substantially overpaying for private vs public markets, and the returns are thus questionable. AQR forecasts PE returns over the next decade to be under 3% – roughly similar to their forecast for S&P 500 – but the former is far more illiquid and much of the gains are removed via exorbitant fees charged by the PE fund managers (Financial Times estimate 60% of PE ‘alpha’ went to the fund manager in funds followed in last decade). This is made worse, in practice, as unless you are invested in one of the top PE funds (which are mostly inaccessible), your return profile is far worse relative to returns from public equities easily accessible via low cost, passive ETFs – in the last 20Y, top PE funds have returned about 16% p.a. relative to a median fund at about 11%, and poorer funds under 8%.
Thus, our portfolio positioning remains defensive, and we prefer to hold higher amounts of cash so that we can add tactically when we see bouts of weakness in equity markets. We would prefer to have a higher weightage of equities as we see it as the ‘least bad’ asset class, particularly against relatively ‘expensive’ USTs, nor the high-yield (HY) or Senior Loan space where risks remain high. Overall, we remain overweight on Alternatives as our belief is that we are entering a period of higher volatility and lower returns and on this basis, we would prefer to derive returns from an asset class that can generate less or even uncorrelated returns to traditional markets, with the benefit of additional diversification.
Equities
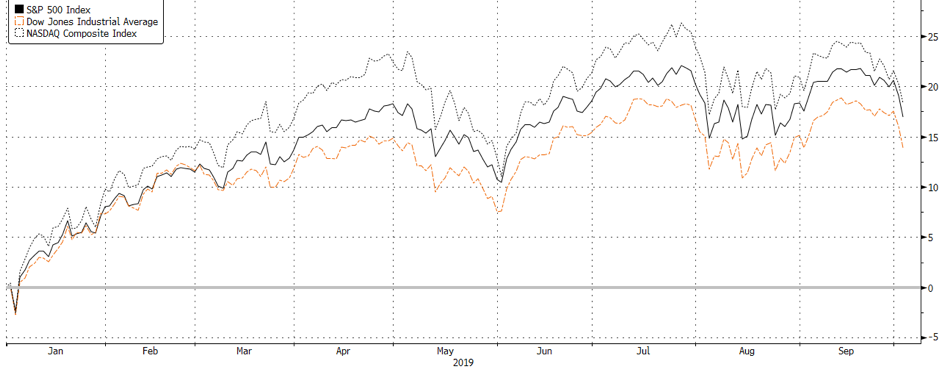
Fig 2: YTD total return performance of US indices in % returns. Source: Bloomberg
-
It was quite a volatile month for equity markets in the US, having climbed the wall of worry to come a few points shy of all-time highs before coming off, then falling even more steeply in early October. A combination of mixed macroeconomic results and the overhang of trade tariffs weighed on markets. Tech stocks continued to see weakness as the Nasdaq underperformed at +0.46% MoM, against the S&P 500 and Dow which were up +1.72% MoM and +1.95% MoM respectively.

Fig 3: Total Return performance of S&P 500 Growth vs Value companies. Source: Bloomberg
-
Within the S&P 500, the month saw quite a marked rotation out of Growth into Value (Figure 3), but also as investors shifted out of YTD winners into names that have underperformed thus far. Financials (+4.46% MoM) and Utilities (+3.96% MoM) outperformed, alongside Energy (+3.56% MoM) which rebounded on the back of higher oil prices following the drone strike on Saudi Aramco’s production facility. Healthcare (-0.32%) was the laggard sector (Figure 4).
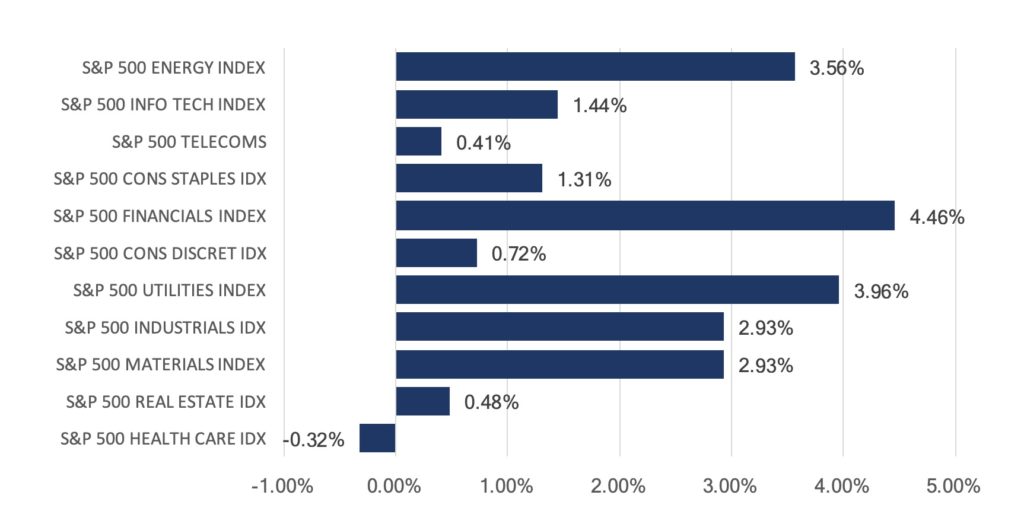 Fig 4: Performance of S&P 500 sectors in September. Source: Bloomberg
-
European stocks saw continued momentum from late August, with the Stoxx 600 gaining +3.60% MoM last month. Markets were buoyed by commitments from the ECB to further ease monetary policy, but also as talk that Germany and France might move to roll out some degree of fiscal easing as well. The German DAX led gains at +4.09% MoM, while the FTSE 100 underperformed at +2.79% MoM as Brexit uncertainty continued to weigh on shares in the index.
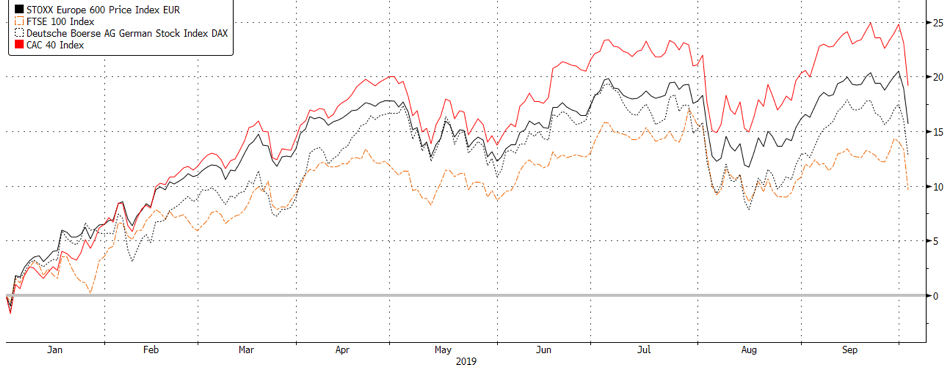 Fig 5: YTD total return performance of major European indices. Source: Bloomberg
-
In comparison, markets in Asia saw mixed performance through the month, with the Nikkei outperforming at +5.08% MoM, alongside the Kospi which also rebounded this month at +4.84% MoM on the back of a recovery in chipmakers.
-
The HSI (+1.43% MoM) was weighed lower by domestic-oriented stocks amidst the ongoing protests in the streets, while Chinese equities also had a weak showing as markets moved on mixed macro data and the ongoing trade negotiations with the US.
-
ASEAN indices underperformed the broader region, with the MSCI ASEAN index falling -0.91% MoM, on the back of USD resilience as currencies in the region floundered. On top, the overarching concerns over global growth were also a negative contributor given the region’s high dependence on this.
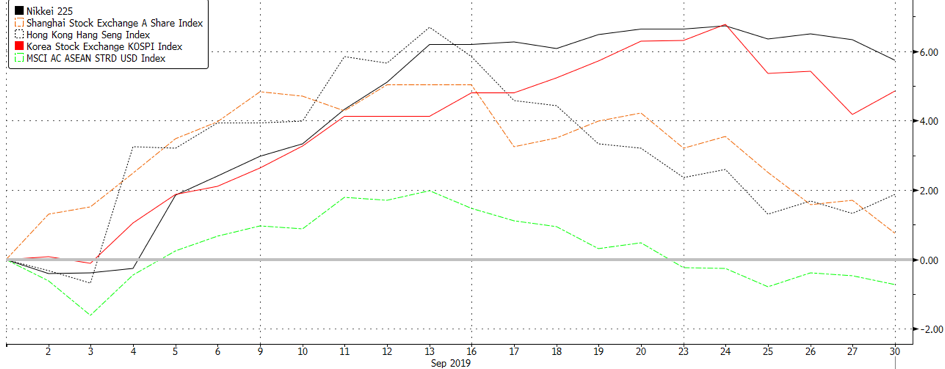 Fig 6: Total return performance of Asian indices in September. Source: Bloomberg
Fixed Income
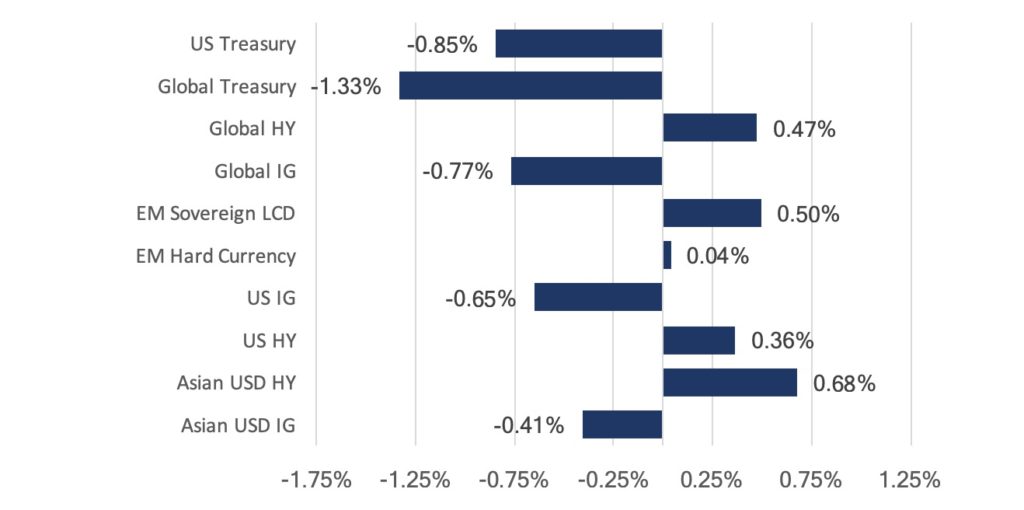
Fig 7: FI Sector index returns in September. Source: Bloomberg
-
The risk-on trade last month saw a rotation out of higher quality fixed income. Sovereign debt was the worst hit (Figure 7), with the Bloomberg Barclays Global Treasury index losing 1.33%. The UST curve shifted higher over the month (Figure 8), with yields rising as much as % following strong August economic data. The German sovereign debt curve shifted higher too, with the 30Y yield going into positive region at one point before ending the month below zero.

Fig 8: UST yield curve in September relative to August. Source: Bloomberg
-
The FOMC meeting outcome lent some support later in there month too – members were divided on the forecasted path of interest rates, based on the dot plot (Figure 9), but the median forecast still showed rates to remain at the same level at YE19 and YE20, as compared to the market’s expectation of 2 more cuts by then.
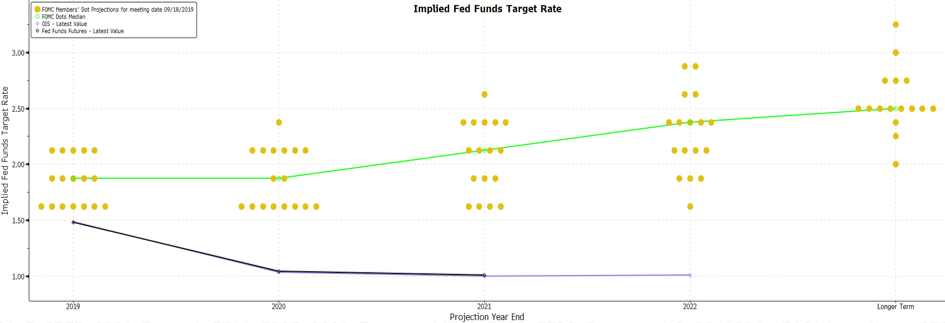 Fig 9: FOMC dot plot in September. Source: Bloomberg
-
However, the disappointing September economic data released last week reignited concerns of slower global growth, causing investors to rotate back into sovereign debt, reversing the gain sovereign yields saw last month.
-
Central banks also remained dovish – in addition to the Fed and ECB, more central banks around the world are expressing dovishness. We had BOE and Norges Bank indicate the possibility of cutting rates at their next meetings, while central banks in Asia like BOJ, BI, BOT, BSP and RBI cutting rates/showing dovish signals. Barring any positive surprises, we expect sovereign yields to remain suppressed in the near future.
-
EMs were also more resilient relative to their DM counterparts. There was a substantial amount of inflows into EM last month, though that could be partly caused by the stronger economic data released earlier in the year, which led markets to think that the economy is stabilizing and that the Fed will stop their rate cuts. We think firms in EMs are in better shape than their DM counterparts, making the current yield differential quite attractive (Figure 10).
 Fig 10: EM/DM yield differential. Source: Bloomberg
-
Corporate credit managed to mostly close the month higher too (Figure 7). High yield debt outperformed the investment-grade sector as it followed equities higher amid the risk on environment, but CCCs were weaker, falling 0.15% after being weighed down by energy bonds (Figure 11).
-
HY saw increased issuance as companies sought to refinance existing debt. US HY companies issued more than $30bn worth of debt last month – the most in c. 2Y. BB debt saw the greatest issuance in the month, making up 42% of total HY issuance, putting pressure on BB yields as it rose 7bps while B and CCC yields fell 24bps and 8bps respectively.
-
IG debt also saw increased issuance over September, with $158.3bn worth of debt issued. This record issuance was also met with strong demand as the corporate IG index spread tightened 5bps. According to Bloomberg, dealer estimates for October call for about $85bn in new issuance.
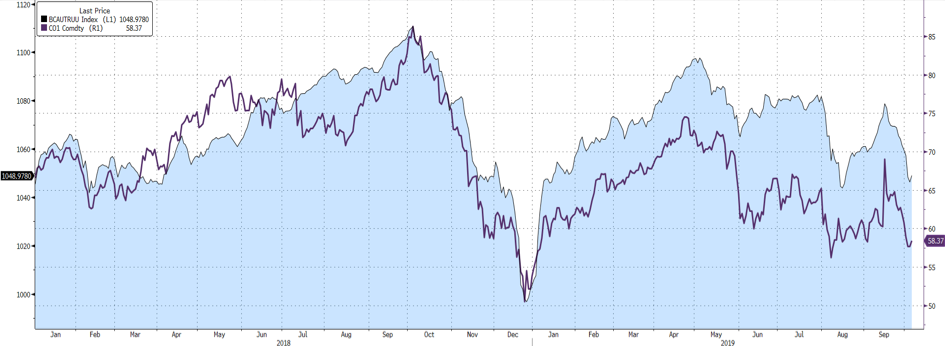 Fig 11: Correlation between US CCC debt (LHS) and oil prices (RHS) – 1st Jan ’18 to 4th Oct ’19. Source: Bloomberg
FX
-
September saw another month of quiet trading as volatility remained low. Volatility continues to be driven by two key events: Brexit and trade uncertainty.
-
USD remained resilient over September but fell in the first week of October on weaker data, with ISM manufacturing falling far below expectations. Although it is well known that ISM manufacturing is but a small part of the overall economic picture – we believe that the disappointing report contributes to the budding fear of an economic slowdown and places much more emphasis on upcoming data.
-
GBP gained 1.09% in September despite Brexit uncertainty as markets seem to have priced in a scenario of an extension following the likely breakdown of Boris Johnson’s new proposal to the EU this week. This caused August’s short squeeze to carry forward. September also saw a small build-up of longs from asset managers and funds, as reflected in recent COT reports (Figure 12).
 Fig 12: GBP net long/short positions. Source: Scotiabank
-
We continue to see further GBP weakness in the short term, before Brexit’s next key development on 31st October and believe that it will test its floor of 1.20, given Johnson’s inability to deliver a deal acceptable by the EU as we think the complexity of Northern Ireland’s border will not be solved by then. Also, with Johnson’s current proposal of a hard border unlikely to be accepted, the uncertainty caused within this short timeframe spells ill for the pound.
-
We must also consider Johnson as the ultimate factor for the pound’s instability. His hard stance toward the UK’s departure on 31st October is likely to generate several headlines (not news). This has also, reportedly, prompted the UK government to initiate preparatory measures in the event of a no-deal, further instilling fear and allowing 1.20 to look very achievable.
-
In the coming months, we do not, however, believe that 1.20 will fail as a support and see GBP rising to 1.25 and potentially beyond (in November and December). Despite the ambiguity of the Benn Act, an act that that requires the PM to seek an extension to the Brexit deadline if a deal is not reached by then, we expect Johnson to abide by that law, thus avoiding a no-deal Brexit in the near-term.
COMMODITIES
-
The drone attack on Saudi Arabia’s refineries led to a high degree of volatility across September. This caused oil prices to spike, with the Brent oil price hitting $70, before sharply retracing to common support level at $58.35.
-
We anticipated the return to its common support on the basis that a single drone strike would be unlikely to warrant such a large reaction in the price. Also, with the theme of a global economic slowdown – which has remained as a roof over the commodity’s price – we saw it as very likely for the spike to simply remain as a spike.
-
Over the next two months, we see the potential for 50 to remain as Oil’s support. This is due to two main reasons, firstly, that much of the news of a global slowdown has already been priced into oil – leaving it with only so much more room for the price to fall and secondly, a substantial amount of the risk premium from tensions in the Middle East (which has escalated substantially, recently) has yet to be priced in. $50 has been a strong psychological and technical support since mid ’17 (Figure 13).
Fig 13: Brent oil sees a strong support at $50. Source: Bloomberg
- While we see fundamental support for Gold in the longer term, we believe it may have seen its limit in the near-term having reached recent highs. We established last month – based on momentum – that Gold’s upwards channel had a key support of 1500. The key signal to its recent turnaround was when Gold failed to break above its recent high of 1550 (Figure 14). One cannot ignore the technical factors simply since momentum remains both its biggest strength and weakness since its stellar climb from 1275.

Fig 14: Gold might see weakness in the near-term. Source: Bloomberg