
Market Update: November 2019
A myriad of positive factors pushed global equities higher, with the MSCI ACWI seeing a total return of 2.76% over the month, before moving higher month-to-date (MTD) in November (+1.35% MTD as at 5th November). This move higher was supported in part by the three US indices, which all achieved all-time highs. European and Asian equities also shook off earlier weakness to close higher due to improving US-China trade sentiment.
However, the improvement in the geopolitical environment helped take a degree of uncertainty off the table, leading corporate credit, particularly investment-grade (IG) debt, to outperform. Markets were risk-on throughout October, extending the gains seen in September amid a combination of a turnaround in trade negotiations, strong economic data, and better-than-expected earnings. Q3 earnings by American and European companies are beating consensus estimates handily.
The Federal Reserve again cut rates but despite the cut, they signalled that it will hold rates for the time being. The US also saw solid economic data and resilient consumption, which taken together with the rate cut, let Morgan Stanley’s model of recession odds in the next 12 months to fall back below 20%.
Volatility in foreign exchange markets remained low, with the UK Pound being the only exception. The currency saw exceptional gains in October, strengthening 5.81% against the dollar as risks of a no-deal Brexit were reduced substantially with Prime Minister Johnson’s withdrawal agreement with the EU. However, the UK parliament failed to vote through the agreement, forcing Johnson to request for an extension to the deadline. Another general election was also called, with the vote tentatively scheduled for 12th December
OUTLOOK
The Federal Reserves’ third-rate cut, along with Q3 earnings beating consensus, has provided support for the case for global equities on a tactical basis. However, risks remain for US equities in the medium-term, with the first being political in nature. Elizabeth Warren is now leading the Democratic candidate and the policies she espouses are set to impact two-thirds of the S&P 500 directly and indirectly. Her policies will, at best, create considerable uncertainty but result in direct damage at worst. Amongst her aims are to ban fracking, break up banks (via the 21st Century Glass-Steagall Act) big tech, increase corporate taxes and target private equity tax avoidance methods. Even if Donald Trump was to be re-elected, there is still bipartisan support around breaking up social media giants and reforming healthcare – including the giant healthcare service organisations.
However, more fundamentally, there are headwinds against US equities’ return on equity (ROE)/operating profit margins (OPM), with the US economic expansion now being the longest ever on record. Should trade tensions not escalate further in 2020, US equities’ defensiveness might be less obvious, enabling a rotation into equities in other parts of the world that have underperformed S&P 500 since the Global Financial Crisis. US share buybacks have arguably peaked in FY18 and Goldman Sachs expects these to slow to $675bn by 2021 from over $900bn in 2018. Separately, there is also the potential for contagion into equities from the problem’s in the $1.1trn leveraged loan market, as well as from any major downgrading of BBB debt into high-yield (HY). S & P 500 – on over 17x forward P/E ratio – is fully valued and especially so if earnings per share (EPS) contracts in FY19 and FY20.
We remain positive on Japan for some of the same arguments as for Europe, although there is a more pronounced structural ROE story linked to improving corporate governance. Asia ex-Japan (AXJ) is trickier as a large part of it depends on the level of USD relative to AXJ currencies. This can go either way but AXJ central banks are easing monetary policy and/or injecting liquidity, while domestic demand stories are resilient. Several countries are also meaningfully cutting corporate taxes (India, Indonesia, and the Philippines) as well as boosting infrastructure spending (Malaysia, Philippines, Singapore, India, and Thailand) – there is a fiscal response to AXJ that is missing from countries in developed markets (DM). We also see China reflating more proactively given the weaker manufacturing PMI data and PPI disinflation. We are not likely to see a huge reflation like 2009/1010 nor 2019, but we could see substantially more stimulus than the very limited amounts YTD.
In contrast, European equities might look relatively better after some progress around Brexit and a recovery in the auto sector from a difficult year. ECB is potentially restarting quantitative easing whilst retaining a very weak monetary policy. Whilst European GDP is weak, it may move sideways in contrast to US GDP, which is set to slow sharply from Q4CY19 through much of 2020. Leading indicators point to European GDP/manufacturing picking up in H1CY20. Less trade uncertainty – admittedly a big if – will also help EU’s very trade-focused economy. Simply put, EU’s economic cycle, as well as equity earnings, lags the US European equities have far greater potential to see riding earnings/ROE’s, with share buybacks accelerating as well – admittedly from a very low level relative to the US. Foreign institutional investors are also underweight European equities, especially UK equities. Whilst ROW/European equities might contract more than US equities in FY19, their outlooks are relatively better in FY20.
However, whilst there is a tactical case to add to equities, we remain cautious for several reasons: 1) Ongoing GDP downgrades will impact earnings while share buyback, which has been the single largest buyer of equities in the last two years, are slowing markedly: 2) A lot is also is riding on Q4 earnings being positive close to double digits as it is off a much lower base in Q4Y18A, but consensus numbers appear optimistic and there is a decent prospect global EPS will contract including US equities: 3) Earnings elsewhere, recent Brexit and trade positives might reverse – we are one tweet from a souring of hopes whilst UK politics is a mess plus markets have already rallied on their positives. Lastly, 4) Investors can sit on cash/remain defensive far longer than is expected.
EQUITIES
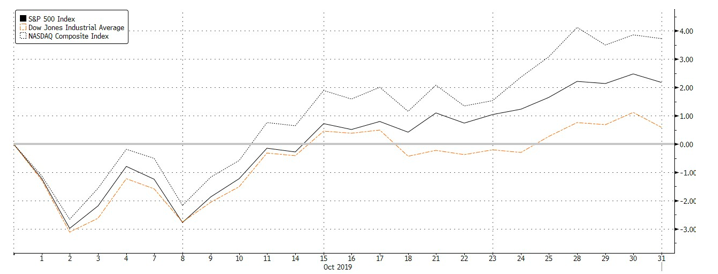
Fig 1: October total return performance of US indices in % returns. Source: Bloomberg
-
US equities had a rough start earlier in the month amid weak September manufacturing data while trade tensions continued to escalate with the US blacklisting of Chinese companies not helping the situation. However, a positive geopolitical environment helped push benchmark indices to all-time highs later.
-
Tech stocks fared relatively well to help the A & P 500 to a +2.04% MoM gain, Nasdaq outperformed at +3.66% MoM, while the Dow Jones lagged behind at +0.46% MoM, weighed lower by a 10.66% fall in Boeing. (Fig 1).
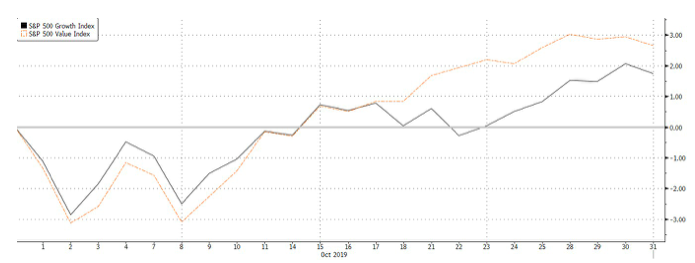
Fig 2: October total return performance of S & P 500 Growth Vs Value companies. Source: Bloomberg
-
Value continued to outperform this month, although the continued rally into early November mostly saw flows back into growth stocks (Fig 2). Healthcare was the best performing sector, on the back of better than expected earnings results, while IT and Communication Services also outperformed. Energy was the standout laggard as oil prices retreated off last month’s spike.
-
October also saw the bulk of S & P 500 companies, with 393 of the 500 companies having reported an aggregate positive earnings surprise of +4.69%, while the headline number for sales was significantly lower, with around 60% of companies reporting an aggregate positive surprise of +0.55%. Healthcare, Financial and IT companies led with the most upside surprises.
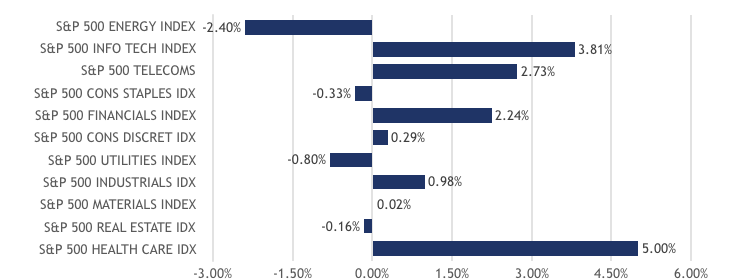 Fig 3: Performance of the S&P 500 sectors in October. Source: Bloomberg
-
In Europe, Germany’s DAX (3.53% MoM) led gains in the region, extending the rally in Stoxx 600 (+0.92% MoM) by yet another month as the pickup US-China trade deal was supportive. In contrast, the FTSE 100 (-2.16%MoM) underperformed significantly as Brexit continued to be a key issue weighing on equities in the UK, and also as the GBP gained significantly over the course of this month.
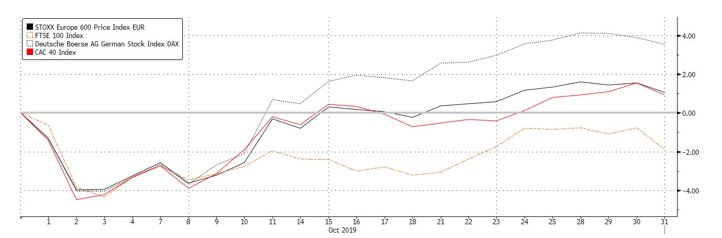 Fig 4: October total return performance of European indices in % returns. Source: Bloomberg
-
Markets in Asia were mostly helped higher by trade optimism too, although Japan’s Nikkei 225 (+5.38% MoM_ outperformed the broader region after a weak set of inflation numbers raised hopes of easing measure, and also as political tensions between Korea and Japan appeared to have simmered. Likewise, the Hang Seng Index (+3.12% MoM) also gained on the back of a recovery in mainland companies despite continued weakness in more domestic-oriented stocks. MSCI ASEAN (+2.20% MoM) was also helped higher by trade optimism, with currencies in the region also seeing a likewise recovery.
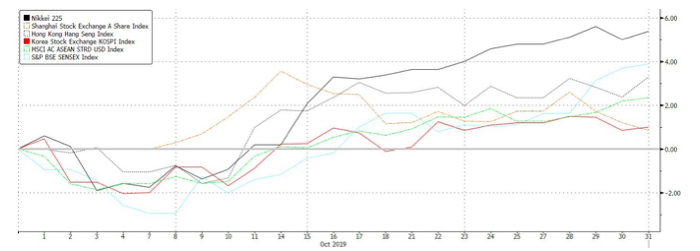 Fig 5: Total return performance of Asian indices in October. Source: Bloomberg
FIXED INCOME
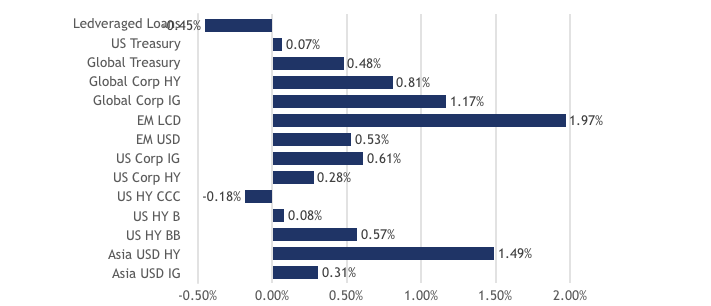
Fig 6: FI Sector index returns in October. Source: Bloomberg
-
The fixed income market was mostly higher last month. The risk-on sentiment was constructive for the asset class, with corporate credit outperforming the sovereign debt space (Fig 6).
Fig 7: DM Sovereign 10-year yields. Source: Bloomberg
-
DM 10Y sovereign yields were mostly edged higher as geopolitical risks tapered off over the month (Fig 7). However, the DM yields pared gains at the end of the month following reports that stated that Chinese officials doubt a comprehensive long-term trade deal with the US can be reached.
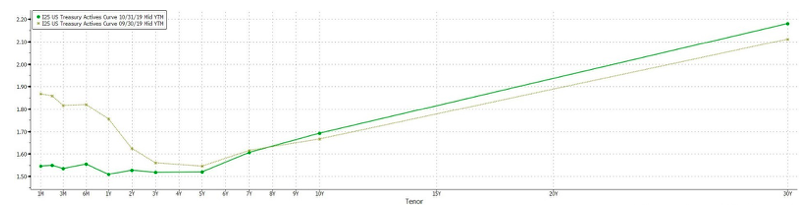 Fig 8: US Treasury curve – September vs October. Source: Bloomberg
-
The UST curve also steepened over the month, with yields of maturities longer than 7Y increasing (Fig 8). Key duration spreads like the 3m/10y and 2y/10y spreads both increased to 16.7bps from -14.3bps to 4.3bps. The 10Y UST moved through a 1.80% resistance while the 30Y yield rose 50bps off lows below 2%.
-
The recent October economic data from the US mostly surprised on the upside, supporting the Fed’s decision to hold rates constant and presents a risk for longer-dated sovereign debt in the US as longer-term inflation expectations rise. Fed futures now predict under 20% probability of a rate cut in December.
-
However, there might still be opportunities in the emerging market, particularly Asia, space. Despite the scale back of geopolitical risks, Asian economies are still relatively weaker while the Asian central banks still have space to ease monetary policy.
 Fig 9: Divergence of CCC yields relative to BB and B. Source: St Louis Fed, ICE
-
Within the corporate credit space, IG debt mostly outperformed HY in developed markets as investors remained cautious amid rising default risks. However, these concerns are largely concentrated in the more leveraged CCC space, with yields diverging from higher-rated HY credit (Fig 9).
-
Another notable observation is the narrowing of BBB-BB spreads to ’07 lows (Fig 10), as investors chase yields in the BB space. This also likely suggests the perceived risks present in the BBB space. CreditSights see just under $70bn of BBB US debt vulnerable to a downgrade into HY over the next 12M. This typically translates to forced sales of these fallen angels due to constraints set by the various portfolio mandates.
 Fig 10: Narrowing of BBB-BB spread to ’07 lows. Source: St Louis Fed, ICE
-
However, we note that HY outperforms IG in Asia. There seems to be an opportunity in Asian USD HY if geopolitical risks ease further and stabilise markets. This yield spread between the sector and US HY is currently attractive (Fig 11) and has space to narrow further should market conditions prove favorable.

Fig 11: Yield differential between Asian USD HY and US HY. Source: Alpinum IM
FX
-
Forward volatility in FX remains at all-time lows. However, October saw some interesting moves with GBP surging on the reality that a no-deal has been pushed to a far corner of the deal table, causing the majority of shorts to reverse, releasing a lot of pressure off Sterling and is now considered to be at a neutral position.
-
Sterling’s shorts began to drastically reverse by $1.60bn on the 20th of October, bringing shorts to an all-time low since Mat (Fig 12). We believe that Sterling’s current price and position are neutral, which implies the next bout of volatility to ramp up this coming December. A Conservative victory is unlikely, but still possible, which may cause the current Withdrawl Bill, a deal far worse than its predecessor and can be considered an ideological “Hard Brexit” to pass.
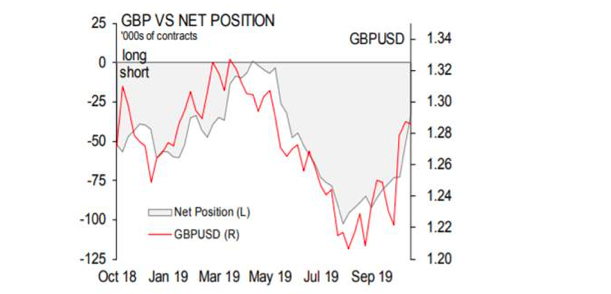 Fig 12: Reversal of GBP shorts. Source: Scotiabank FICC Strategy, Bloomberg and CFTC
-
The repercussions of such a deal will prevail for years and spill into all trade negotiations with the EU. The UK’s FAI, FDI, and GDP growth will be severely impacted, and it is also worth noting that the Brexit Damage Assessment has yet to be released. This gives rise to our belief that GBP will once again trade sideways in its current range of 1.25 and 1.35 until we near the elections.
-
A positive outcome of the elections is a hung parliament, as this implies that none of the extremist, nationalistic or radical parties are passed and may lead us to a second referendum and amendments to the Withdrawl Agreement (a ‘soft’ Brexit). This will be the most constructive path for the Sterling and could finally see the Sterling in a temporary net-long position.
-
The worst-case scenario would be a Labour victory – their policies are severely more damaging and could have a harsher impact on FDI which will eventually lead to large portfolio selling. We could see the GBP dip to 1.20.
-
In the longer term, we remain Sterling Gears as, under most scenarios, Brexit remains a likely possibility and therefore harmful to the UK”s economy, to FDI and to FAI. Structurally, the UK suffers poor productivity and higher inflation than its developed market peers and has borrowed too much today that will reduce forward growth. Multiple UK governments have addressed these structural weaknesses by enabling GBP to depreciate and thus it is likely that this will continue.
-
CNH (+2.26% MoM) and JPY (-1.00% MoM) also saw some movement as China’s stimulus policies began to take effect and reversed some of the damage from trade disputes. The Caixin Manufacturing PMI diverged further from the official PMI and rose for a 4th straight month in October to reach a 2Y high, while improved risk sentiments over the month weighed on the JPY.
COMMODITIES
-
Oil prices moved slightly higher over the month as the reduction in trade tensions helped improve sentiment around the global economy, and thus, oil demand. This helped relieve downward pressure on oil prices, ut the potential ascent to $70 remains very fragile and relies heavily on the positive development of trade and for the Middle Eastern tensions to escalate. We expect oil prices to trade flat between a range of $55, a new medium-support level as well as $65, its 2000DMA.

Fig 13: Gold positioning. Source: Scotiabank FICC Strategy, Bloomberg and CFTC
-
Gold’s positioning has significantly thinned since its stellar rise from $1,275/oz (Fig 13). Gold remained very technical for the month of September up until the recent, positive developments on Brexit and trade developments that edge investors to be risk-on. Gold strengthened, briefly to $1520/oz, as October ended with the Fed’s decision to cut rates, just before positive trade development and US jobs data weighed on risk-on sentiment. $1,480/oz, previous key support, is now once again in effect.