
Jun 29, 2021 | Articles
For Accredited Investors Only as defined in the Monetary Authority of Singapore Securities and Futures Act (Cap. 289) and its subsidiary legislation. For Professional Investors Only as defined in the Securities and Futures Ordinance (Cap 571, Laws of Hong Kong) and its subsidiary legislation. This advertisement has not been reviewed by the Monetary Authority of Singapore.
Dear Clients,
Odyssey is an asset management firm that is focused on seeking out attractive investment opportunities in the private markets. We invest in thematic opportunities in sectors we believe represent good value and are anticipated to achieve superior risk-adjusted returns.
We often employ value add strategies such as refurbishment, reorganisation and repositioning, which increase the capital appreciation and cash flow generation over time. Where strategically advantageous, we partner with local execution partners who have long and successful track records in the niche sectors and strategies we are most interested in. One such sector that we have been building a position in is Student Housing in the United States.

Unlike the UK or Australia, US students have stayed on campus, and combined with a strong rebound from COVID-19, US Universities are seeing record levels of enrolment for September 2021 and into 2022. This is helping drive the continual need for new and updated student accommodation at campuses around the country, particularly as universities allocate capital to non-housing facilities such as classrooms and sports centres.
To illustrate the opportunities we are seeing in this sector at this time and to provide a clear understanding of the overall market, we have prepared three separate Thought Pieces entitled:
Part 1: Student Housing Introduction & the Sector at a Glance
Part 2: Deep Dive into the Industry Dynamics & Fundamentals
Part 3: Case Study & Value Proposition – potential REIT Listing
Following the release of Part 1, we are delighted to share Part 2 in our Thought Piece series.

If you like to receive more information, please contact:
James Wheeler
Managing Director – Head of Distribution
james.wheeler@odyssey-grp.com
www.odyssey-grp.com

Jun 23, 2021 | Articles
For Accredited Investors Only as defined in the Monetary Authority of Singapore Securities and Futures Act (Cap. 289) and its subsidiary legislation. For Professional Investors Only as defined in the Securities and Futures Ordinance (Cap 571, Laws of Hong Kong) and its subsidiary legislation. This advertisement has not been reviewed by the Monetary Authority of Singapore.
Dear Clients,
Odyssey is an asset management firm that is focused on seeking out attractive investment opportunities in the private markets. We invest in thematic opportunities in sectors we believe represent good value and are anticipated to achieve superior risk-adjusted returns.
We often employ value add strategies such as refurbishment, reorganisation and repositioning, which increase the capital appreciation and cash flow generation over time. Where strategically advantageous, we partner with local execution partners who have long and successful track records in the niche sectors and strategies we are most interested in. One such sector that we have been building a position in is Student Housing in the United States.

Unlike the UK or Australia, US students have stayed on campus, and combined with a strong rebound from COVID-19, US Universities are seeing record levels of enrolment for September 2021 and into 2022. This is helping drive the continual need for new and updated student accommodation at campuses around the country, particularly as universities allocate capital to non-housing facilities such as classrooms and sports centres.
To illustrate the opportunities we are seeing in this sector at this time and to provide a clear understanding of the overall market, we have prepared three separate Thought Pieces entitled:
Part 1: Student Housing Introduction & the Sector at a Glance
Part 2: Deep Dive into the Industry Dynamics & Fundamentals
Part 3: Case Study & Value Proposition – potential REIT Listing
We will be sending each thought piece over the next week, with the Part 1 being accessible here.

If you like to receive more information, please contact:
James Wheeler
Managing Director – Head of Distribution
james.wheeler@odyssey-grp.com
www.odyssey-grp.com

Jun 10, 2021 | Articles, Global Markets Update
For Accredited Investors Only as defined in the Monetary Authority of Singapore Securities and Futures Act (Cap. 289) and its subsidiary legislation. For Professional Investors Only as defined in the Securities and Futures Ordinance (Cap 571, Laws of Hong Kong) and its subsidiary legislation. This advertisement has not been reviewed by the Monetary Authority of Singapore.
Playing the Long Game
Since the beginning of the year, we have been mildly cautious in our commentary. The equity market appeared to be getting ahead of itself with rapid economic recovery widely anticipated. While the economy has been largely robust, the real economy is a little like the equity market, there are mini-cycles within the larger cycles. With strong economic data in Q1 2021, particularly in the US, it was not a surprise to see some cooling for April and May data. This may persist for a few months before the economy again gathers steam. There is likely to be too much easy money floating around for spending to simply stagnate for a protracted period.
Apart from the various stimulus programs around the world, we have also mentioned previously about the USD2+tn of additional savings in the US since the start of the COVID. However, these pale in comparison to the wealth created by the stock market. The MSCI World Index has gained 23% since the pre-COVID peak. That’s USD10.7tn of wealth creation, equating to 13% of world GDP. This wealth would have far greater impact if it was evenly spread, nevertheless, it should still greatly boost consumer spending power. The gains of the relatively wealthy may also pressure the redistribution of wealth as we are seeing with President Biden’s capital gains tax proposals that would ultimately benefit more broad-based spending.
The other factor is economic re-opening. With governments in Singapore, Hong Kong, and Australia clamping down on travel and social distancing restrictions in recent weeks, it may be easy to lose sight that the largest centres of COVID infections have witnessed dramatic falls in infection rates. US new cases are now below 10,000 per day. Just five months ago they were peaking at over 300,000 per day. That’s a 97% drop in numbers. Already, more than half of adult Americans are fully vaccinated and 62% have had at least one shot. In India, the infection rate remains high and the efficacy of detection remains debatable, however, reported new cases are now less than a quarter of where they were at the beginning of May. Some variant of COVID is likely to be around for years, but as the world steadily becomes vaccinated, it is likely to be a case where we learn to live with virus rather than the current stop-start to full reopening.

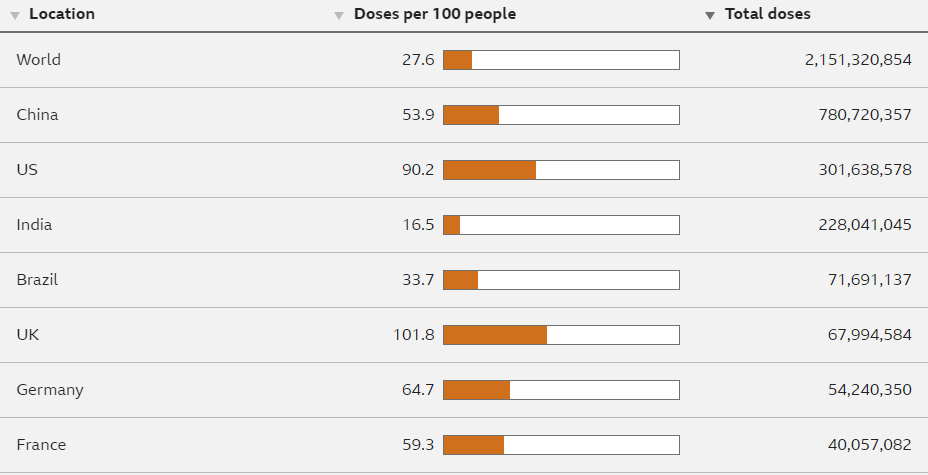
Source: BBC News
If It’s Not Broken…
In recent years Growth stocks have clearly outperformed Value stocks. Indeed, from April 2020 to the end of 2020 (post-COVID sell-off), the MSCI World Growth Total Return Index outperformed MSCI Value by 22%. However, YTD to the end of May, Value is up 17% and has outperformed Growth by 10%. With the prospect of continued economic re-opening and the potential for regulatory headwinds for certain mega tech stocks we expect a diversified portfolio may continue to outperform a growth portfolio over the Northern summer. For example, recent discussions between the G7 on a 15% Global corporate tax rate could provide a headwind for mega tech stocks such as Google, Apple, and Facebook to name just a few until the issue is finally resolved. Considering the complexity of the issue, this may drag on for some time. In the meantime, these companies have a structural and operating tailwind so price performance will likely hinge on which contains the greater surprise factor.
The clear outperformance of Growth over Value is a relatively recent phenomenon. Even during the Dotcom boom, Growth did not really stand out in terms of performance until 1999, the final year of the bubble. During the 2003-2007 bull market, the MSCI World Value Total Return Index outperformed the Growth Index by 9%. In fact, after both the 2001/2002 recession and the 2008 GFC, Value clearly outperformed Growth in the year following the market trough. The difference during COVID was the government-imposed restrictions on travel and social distancing which favoured products and services that enabled online access. It appears as though equity investor views are now also “normalising”.
The clear outperformance of Growth over Value started to occur at the beginning of 2017. One could argue about the reason behind the performance. Was it the flattening of the US yield curve as the short end rose that occurred at almost the same as the start of the outperformance of Growth? Market theory and strategists may suggest this was the cause and they are probably at least partly correct, but I prefer a more mundane business reason such as demand for tech products beginning to accelerate. Tech companies have been the big driver of Growth Indices. Google used to provide search query statistics and we could have used that as a proxy for the growth of online products and services but they stopped providing that information in 2013. However, we can still use Google’s/Alphabet’s revenues as a guide. By 2017, Google was already reporting USD110bn in annual revenue, hence percentage growth may not provide an accurate gauge of industry growth, but when we look at absolute growth we can see there is indeed a jump from 2015 to 2018. There is a tripling in revenue growth in absolute terms. Facebook’s revenues show a similar acceleration in absolute dollars over this period. This indicates a large step-up in the amount of money being spent for online services.
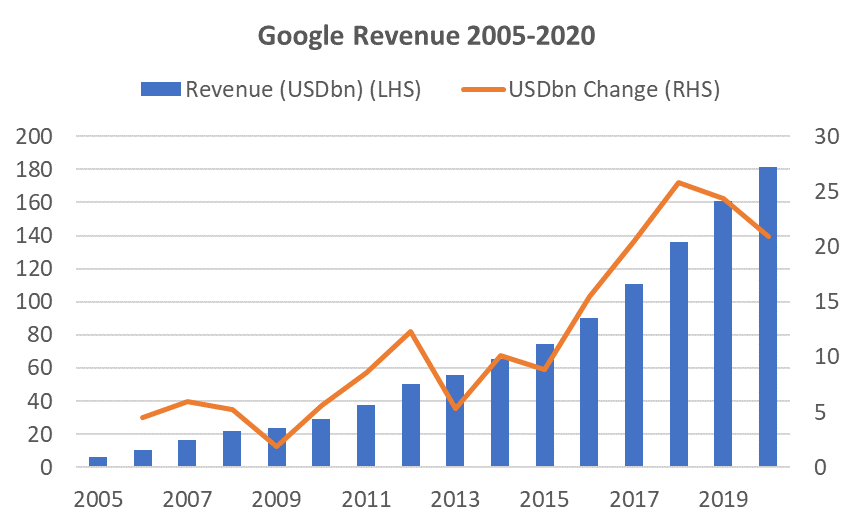
Source: Statista.com
In 2020, certain tech companies like Zoom specifically benefitted from COVID and had massive growth rates from a low level, however, it was not yet obvious that this would be followed by a structural surge in spending on tech companies. This required the mega-caps to show an acceleration in growth. Google’s revenue growth both percentage change and absolute terms had been falling since 2018, but in Q1 2021, revenue growth was a huge 34%, or USD14bn in just one quarter. This is the largest percentage change for a quarter on a y-o-y basis since Q4 2012 and the largest gain in dollar terms for the company ever. It indicates that spending on technology services (in this case advertising) was coming back and notably far stronger than it was previously. This is supported by robust results from Facebook, Snap, and others that largely depended on advertising.
The percentage growth rates appear unsustainable for the mega-caps, and indeed, consensus forecasts for subsequent quarters are more subdued, but as to the question as to whether there has been another acceleration in revenue spent on the sector to justify a large increase in tech share prices, the answer is “yes”. Whether the quantum of the share price increases is justified is a more difficult question, and because it appears more difficult, the market may take some time to digest this conundrum which, together with the regulatory uncertainty, could see tech stocks, and hence Growth Indices, range-bound in the interim.
Investment Recommendations
Progress on Laggards
In recent months we have been tilting recommendations towards laggard stocks, those that are currently out of favour. Because of this, sometimes investors need to be patient. Other times, the wait may be a short one as we have seen with Eli Lilly (LLY), a name we suggested last month. If you recall, mixed results on their drug for Alzheimer’s saw the stock drop significantly. Nevertheless, we mentioned that the drug, based on data to date, appeared to be as effective, if not superior, to Biogen’s Aduhelm. Well, Aduhelm, somewhat unexpectedly, received FDA approval on June 4 and the stock rocketed as much as 50% before settling 40% higher. LLY, having a 5x larger market cap, settled 9% higher on the news. Overall, it’s been a 12% pop since our recommendation which is a nice little win on a mega-cap in an uninspired market. Among other “event-driven” trades we also highlighted the Cruise-liners two months ago. Royal Caribbean is expected to resume US cruises on June 26th. This stock and Norwegian Cruise Lines, which are expected to start US cruises in July, are up a little from our recommendation but have yet to break out of the trading range that a sentiment change would likely precipitate.
US Transport – a Mix of Tailwind and Recovery Potential
This sector is intriguing. There is a mixed bag of firms that i) benefitted from COVID such as UPS, logistics company Expeditors International, and road transporter JB Hunt, ii) some that were mildly negatively impacted such as FedEx and rail transport, and iii) others where operations were decimated such as the airlines. The latter is one of the few subsectors where share prices remain significantly below pre-COVID levels. Even the major US hotel chains are trading above pre-COVID levels despite 60-65% occupancy rates. Meanwhile, airline bookings for the week of June 4-10 are 83% as high as those taken over the same period in 2019. American Airlines recently mentioned that their load factor in May was 84% and that they were seeing yields at or above 90%. We don’t want to make too much of a continuing difficult time for airlines but obviously, the trends are currently improving.
There are two liquid ETFs that cover the US transport sector, IYT, and XTN. Both have their unique features, particularly XTN which is equal-weighted with 41 positions whereas IYT is concentrated with only 20 positions. Curiously, despite their differences, their performances have been similar for the last 5 years.
Transport ETF Subsector Exposure
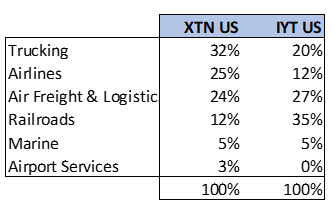
Chart: Performance of Transport ETFs and JETS US (predominantly US airlines ETF)
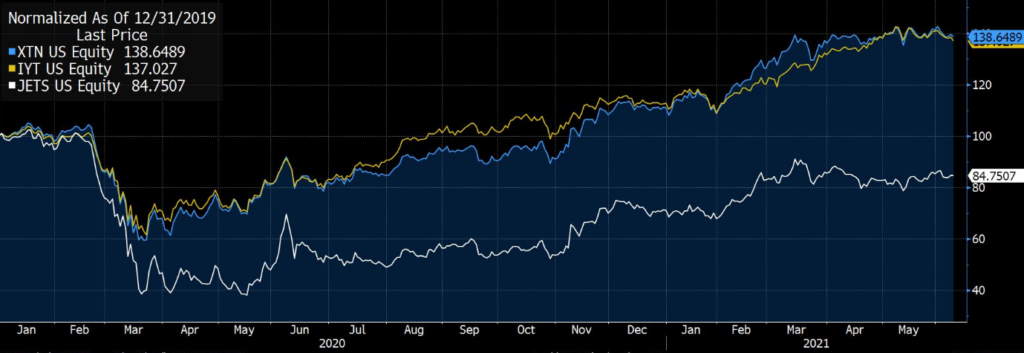
Source: Bloomberg
Logical to Like Logistics
There are also 2 stocks we like in the Transport sector. One is FedEx (FDX) that we have highlighted in February’s Insight after the stock price slipped despite a robust operating performance. The company is expected to announce Q4 earnings on June 24 (May YE). The other is a stock called XPO Logistics (XPO) which is benefitting from the secular tailwinds from growth in e-commerce. It has a diversified business with approximately 60% in transportation and 40% in logistics. The geographic split between the US and European exposure is similarly 60:40. Revenue has grown from just USD7.6bn in 2015 when the company was still loss-making to a consensus USD19.3bn in revenue and USD676mn in estimated profit for 2021. Since 2015 YE the share price has risen by 440%. In December 2020 the company also announced that it intends to spin-off the logistics business in H2 2021 that may result in a positive re-rating of the combined business.
When speaking of logistics, it’s difficult not to mention, Prologis (PLD), a REIT that focuses on logistics facilities and is the largest industrial real estate company in the world. A combination of robust growth prospects, high occupancy (95%), and strong pricing is likely to produce compelling NAV and cash flow growth over the medium and long term. PLD estimates that e-commerce consumes 3x more space than brick and mortar retailers because transport costs account for 50% of supply chain spend, which places pressure on the need for warehouses near population centres. While there is a risk that the stock is already well-discovered and well-held, the fundamentals provide a strong case for ownership. A smaller logistics REIT that has a domestic US focus is Duke Realty (DRE). It is only one-fifth the market cap of PLD. Both provide an expected dividend yield of circa 2% for 2021. Back in March we noted the strong recovery of REITs as an asset class and postulated there still may be further upside.
Odyssey Model Portfolio Performance
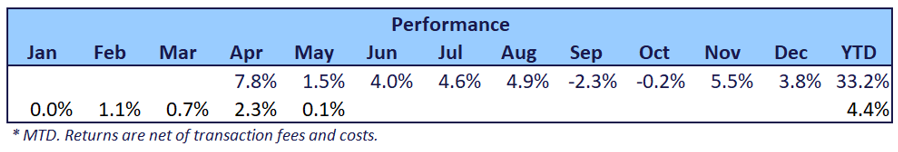
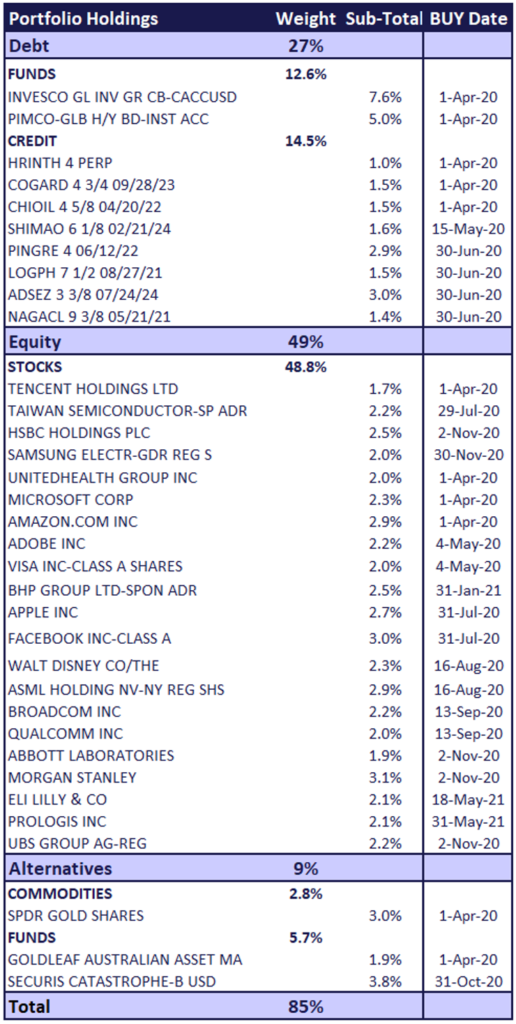
Note: Due to a technical issue, we are not able to provide returns for the securities in the Model portfolio for this month.
If you like to receive more information on our portfolio solutions, please contact us here: info@odyssey-grp.com.