
May 22, 2019 | Articles, Daimon Brewery
With the recent passing of the Japanese Golden Week holiday, I wanted to send you all a warm welcome to the new era – REIWA. This was officially on 1st May, where we launched the new era for Japan and one for Daimon Brewery as well! With our namesake the RIKYUBAI flower (pictured below) in full bloom and our garden showing the many signs of Spring we welcome these next few days to appreciate our continued expansion of the Daimon Brand.

Sales continue to grow with Year on Year growth at +200%, Half on Half growth at + 180% and Month on Month growth consistently trending above 200%. This news is further accented by a recent report from the tax authority stating that in Osaka only two breweries are up year on year – Daimon Brewery at triple digits plus another who’s growth was a marginal 3%. In addition, our International sales remain on target with growing opportunities as we have concluded deals in the USA, Sweden, Denmark, France, soon to be Italy and regionally with the addition of Taiwan. The US deal will represent three of our products – inclusive of a specially designed “Nigori” for the Nigori focused American market. All of our US products are to be launched this summer and presented by our importer at the biggest American Sake Event of the year in San Francisco. And finally, for our friends in Hong Kong, we continue to build out our OEM and private label product opportunities with the latest addition of Hong Kong based Four Fox Sake.
To support our sales, we continue to push our marketing via social media (we hope you are all viewing our regular updates), print and soon to be video. In print, the leading Sake industry publication, Sake Today, will feature Daimon Brewery as the main story in their next addition. In video, we are 6 months into our documentary filming having captured the whole production season. In partnership, we are in negotiation with National Geographic to be the “Japanese Food and Beverage” portal of their soon to be launched interactive site, and finally stay tuned for future updates that will include a new initiatives for You Tube.
On site we just finished our 4th full Daimon Festival with great success. Our largest crowd ever with two revolving jazz bands, street venders and our first ever partnership with a bakery that produced all its products using our Sake lees and koji rice – a great boost to the local community. In addition, our weekly Friday Sake Night continues to draw crowds of upwards of 60 people and Mukune continues to fill the house on the weekends.
The next step will come next month as the Board concludes our six-month strategic review to launch us into phase two of the project. As we continue to see many opportunities through the marketplace we are now determining how best to include these strategies, increase our international presence and build out our brand. We will of course update you on that discussion once concluded and look to you for your continued support. In the meantime, we hope that this new Era will bring you all back to the Brewery for a visit in the not so distant future.
Wishing you all the best for REIWA!
Marcus Consolini
CEO
Daimon Brewery

May 16, 2019 | Press Releases
[An outdoor bath at Shosenkaku Kagetsu, Yuzawa]
From Bloomberg.com:
“Private equity funds like Softbank-owned Fortrsess Investment Group LLC and Hong Kong-based Odyssey Capital Group are spending billions to tap into the appeal of traditional inns amid a tourism boom that’s ramping up ahead of next year’s Tokyo Olympics. The big funds are moving in as centuries-old spas, many of them still family-run, struggle to find successors in an aging country where small towns and villages are losing young people.”
“ Odyssey, along with two other investors, last year purchased its first Japanese onsen, an inn with 28 tatami-floored guest rooms near the Sea of Japan called Kagetsu, or “flowering moon.” Christopher Aiello, managing director of Odyssey’s Japan real estate business, says the firm plans to spend $500 million in the next three years buying about 20 more traditional Japanese hotels, which are known as ryokan.”
Read the full article on Bloomberg here.
Click here to download the full article.
Odyssey Asset Management Limited
Odyssey Asset Management Ltd, a sister company to the Odyssey Capital Group, is a Hong Kong SFC 1, 4 & 9 licensed company. The Japanese CRE team is headed up by Christopher A. Aiello, and also includes Alex Walker, Daniel Vovil and Sam Luck.
Odyssey Capital Group Ltd is Asia’s leading international Alternative Asset Manager that provides differentiated and bespoke investment solutions across multiple asset classes, including asset management, real estate, private equity and hedge funds. The Firm’s primary focus is to seek out undervalued investment opportunities to co-invest in with its clients.
The Odyssey team comprises over 30 experienced executives, asset managers, lawyers, private bankers, trust & tax planning specialists and experienced investors with over 400 years of combined financial and operational experience across the Asia Pacific, Europe and North America.
For more information about the Odyssey Japan Boutique Hospitality Fund, phone or email Daniel Vovil via the contact details listed below.
Daniel Vovil, Co-Founder and President, Odyssey Capital Group
daniel.vovil@odysseycapital-group.com | (852) 9725-5477
May 14, 2019 | Articles, Global Markets Update
April found equities in good health, led up by the S&P 500 (+3.93% MoM) and followed by Stoxx (+3.23% MoM) on a combination of trade optimism, ‘dovish’ central banks’ rhetoric and better earnings off Q1FY19 results. Asia ex-Japan (AXJ)/Emerging markets (EM) equities lagged as USD strengthened and Q1 earnings were mixed, although Chinese equities saw a robust ‘beat’ on Q1FY19 results. Fixed income (FI) continued to see inflows to higher quality bonds as parts of the market worried about the risks in credit from a pick-up in defaults. 10y US Treasury (UST) yields recovered from recent lows at around 2.30% to trade in a range of 2.50% to 2.60%, and the UST 2y/10y spread widened out to 23.6bps, dampening talk of an imminent recession after yield curves inverted briefly.
FX saw volatility in several EM currencies around domestic political troubles including Turkey, Argentina – Peso fell to an all-time low – and Brazil. DXY gained through the month on relatively better US macro data relative to other developed markets (DM) and Powell was seen to be more ‘hawkish’ after last week’s Federal Open Market Committee (FOMC) meeting. GBP tested lows at 1.2900 but recovered over the last week to regain the 200DMA support after the Conservative party lost badly in the local elections, spurring hopes they might be more willing to compromise and reach an agreement with the Labour party. The Brent oil price tested 6-month highs above $75/brl after the US ended waivers for countries importing oil from Iran but signs of OPEC+ disunity, notably with Russia, and rising US oil inventories saw the price retreat towards support at $70/brl. Gold moved inversely to USD strength and higher UST yields to fall back below $1,300/Oz and test support at $1,270-80/Oz.
The key decision regarding risk assets is whether Trump and subsequently Lighthizer, are bluffing when threatening to impose 25% tariffs across all imports from China (including $325bn of tariffs they’ve not imposed so far) this Friday. US equities, USD and Gold’s immediate reaction suggests the base case is it is a bluff. Reading various US brokerages on the threat, most seemed to agree with the ‘bluff’ thesis too, with a view neither USA nor China, and that neither Trump nor Xi, want to let a deal fail given the economic and political damage of a failure at this stage. There was one exception to the ‘bluff’ thesis that noted – after contacting people known to them within the US administration’s trade team – that the US had become annoyed by China’s recent reversal on certain agreed points and remained stubborn over key issues such as subsidies to state-owned enterprises, technology transfers and its ‘Made in China’ industrial policies. The piece suggested that, rather than a bluff, the US was deadly serious, and this is a very real breakdown. We would not dismiss this alternative thesis out of hand. We have reiterated several times there was a material risk, about 30% to 40%, a deal would not happen in H1CY19 given the red lines for both countries and the political need for both Trump and Xi to satisfy domestic audiences. On top, in the US, there is clearly a view this is the US’s best opportunity to challenge China’s trade practices and require structural changes before it is too late.
On a medium basis, assuming the trade news works its way out, there are two more fundamental risks, to our cautious view. The first is that Q1 EPS results materially ‘beat’ lowered consensus, hence resulting in decent upgrades to earnings forecasts (ERR). ERRs have been falling for several months, with S&P 500 Q1 consensus cut by over 10% from levels forecasted at the end of September ’18, so it is of note that LGT thinks the ERR for S&P 500 ticked up since results started. S&P 500 has moved sideways since results began, with top-line numbers mostly below expectations, but strong results from the likes of Facebook and Microsoft helped US equities.
The second risk is that falling GDP forecasts stabilise, or even get revised upwards. Thus, it is of interest that Goldman Sachs (GS) have raised their US GDP forecast for ’19 and ’20 to 2.4% and 2.5% (GS rightly noted, if they were to be right, that this might suggest the Fed has become overly cautious). Likewise, sell-sides strategists are noting that China’s reflation is working, and both UBS and HSBC have revised forecasts up to 6.5% for ’19 from 6.2%. Separately, GS sees EU GDP stabilising in Q2 whilst UBS thinks Q1 numbers will surprise to the upside. Overall, GS thinks the global economy will recover from Q2 onwards and pick-up into H2. Should ERRs inflect positively and GS be correct about the imminent recovery in GDP, then equities will be able to ‘bridge across’ to a better H2 and the rally could continue, although it implies UST will sell off. Both Credit Suisse (CS) and UBS have increased their equity allocations last week for the reasons above.
However, the ’bridge’ argument is not our base case. We see a correction as quite possible and have some sympathy with a John Auters piece that argued markets have rebounded too quickly from the sell-off in Q4. He thinks that valuations are not supportive, that we are later in the economic cycle and that he thinks the next move will be to correct sharply again. John suggests markets are more like a boy on the slide and that he will slide down again once he gets to the top. We have completed – fast – a perfect slide to the bottom and then back to the top since September. We are more in the ‘slide’ camp than the bridge over to a better H2, but are well aware there’s a danger of underestimating the resilience of S&P 500 earnings and the strength of the US economy (and at the same time overestimating the same for Europe and Stoxx). The old adage, ‘Sell in May and go away’, might have more relevance this year again!
Given it is a 50/50 bet as to whether Trump is bluffing or not, it would be foolish to be buying into these moderate declines outside A-shares. We had deliberately built up cash levels across portfolios YTD and thus are decently defensively positioned. This month, as noted before, is quite perilous so acting too quickly is likely to be a mistake. For now, we will ride the volatility and not do too much.
Equities
-
Shares in the US continued their steady climb into the midst of earnings season, with the S&P 500 (+3.93% MoM) and Nasdaq (+4.74% MoM) inching into all-time high territory, while the Dow Jones Industrial Average (DJIA) (+2.56% MoM) has come close despite having lagged YTD (Figure 1). This underperformance has been largely led by earnings’ disappointments in blue chips like 3M and Intel, but also as shares in index heavyweight Boeing suffered amidst uncertainty around the 737 MAX.
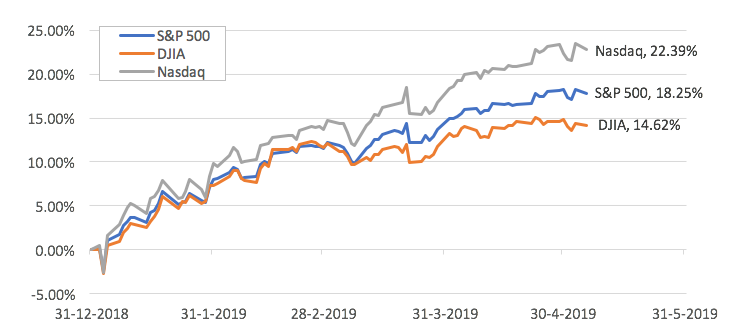
Figure 1 Total returns YTD of major US indices Source: Bloomberg
-
As of 3rd May, 78% of companies in the S&P 500 have reported earnings for 1Q19, 76% (above historical average) of which have reported aggregate earnings beat while 60% (mostly in-line with the historical average) reported a positive revenue surprise. So far this quarter, the index is tracking a -0.8% earnings decline which will mark the first YoY decline in earnings for the index since 2Q16.
-
The key data release this month was a 1Q19 GDP surprise, coming in at +3.2% against estimates of a +2.3% increase, though this was mostly driven by ‘transitory’ factors related to trade and inventory which added an estimated 1% to the headline figure. Stripping these anomalies out might suggest a reading that was mostly in-line if not slightly lower-than-expected, although we would highlight that Q1 data has had a major problem with accuracy for years.
-
US-China trade news will dictate the shorter-term outlook for the S&P 500. Our base case is that a deal will be struck as it is in the economic interest of both countries, and the political interests of both Trump and Xi, to do so. However, both sides have ‘red lines’ and there is a material chance, perhaps as high as 30-40%, a deal cannot be agreed upon, and that the US will impose 25% tariffs across all imports from China.
-
Additionally, Trump must, by 18th May, decide whether to impose auto tariffs on global imports to the US. We think he might hold-off doing so to Japan as both countries are in talks, but it is highly probable Trump will impose tariffs on EU with Germany a notable target, although we think a resolution could be quite fast. In the event of a resurgence in trade tensions, the S&P 500 will prove relatively defensive.
-
European equities followed their US counterparts higher in April but led by a steep recovery in Autos (+9.31% MoM), and sizeable gains in the Technology (+7.68% MoM), Banks (+7.54% MoM) and Industrials (+7.28% MoM) sectors. Defensives like Health Care (-1.90% MoM), Real Estate (-1.21%), Telcos (-0.64%) and Utilities (-0.34%) underperformed amidst the broader market rally.
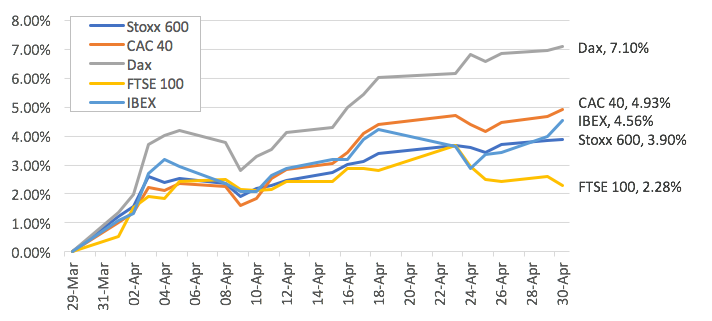 Figure 2: Stoxx 600 Total returns against EU indices in April Source: Bloomberg
-
Across indices in the region (Figure 2), the German DAX (+7.10% MoM) was a clear outperformer on a total return basis, followed by the French CAC 40 (+4.93% MoM) and while Spain’s IBEX (+4.56% MoM). Despite more confirmation around a Brexit delay and as tail risks of a ‘hard Brexit’ subsided, the FTSE 100 (+2.28% MoM) still underperformed quite significantly in April.
-
After the ECB turned markedly more ‘dovish’ last month, helping fuel a rally in Stoxx and a weaker Euro, attention going forward will be on what action this might imply with some more bearish strategists anticipating ECB may have to resume QE before the year-end given a weak EU economy.
-
Stoxx earnings revisions saw the strongest pick-up in the last week in over ten months and Q1FY19 might be the best quarter for results in two years. It remains to be seen if actual results confirm this recent optimism that appears at odds with very weak economic data – especially in exports and manufacturing.
-
The hope is the weakness in the EU economy will be temporary and more a short-term cyclical downturn in manufacturing that is linked to trade disputes and that China’s reflation, with a three to six months lag, will show up in better EU data during Q2. However, if the US-China trade deal fails and the US imposes auto tariffs on EU, an industry which employs over 1mn people in Germany alone, it is possible EU could fall into a recession.
-
In Asia (and amongst the bigger global indices), Japan’s Nikkei (+4.97% MoM) has been the quiet outperformer ahead of their ‘Golden Week’ holiday which ran from April 27th to May 6th, while the Shanghai Composite Index (-0.38% MoM) closed the month flat despite having pushed YTD highs over the course of this month (Figure 3).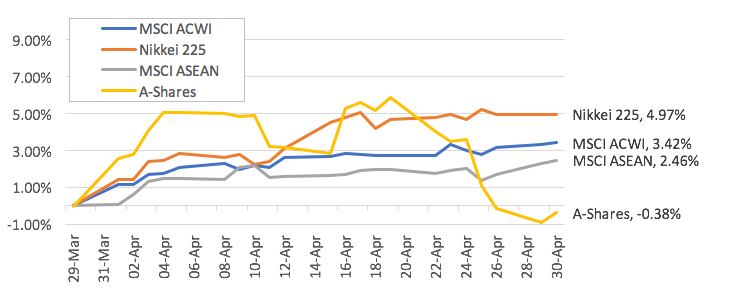
Figure 3: Underperformance of A-shares in April Source: Bloomberg
- ASEAN countries were also noticeably weak, and have been an underperformer so far this year, not least weighed down by continued strength in the US Dollar and relatively higher oil prices (Figure 4).
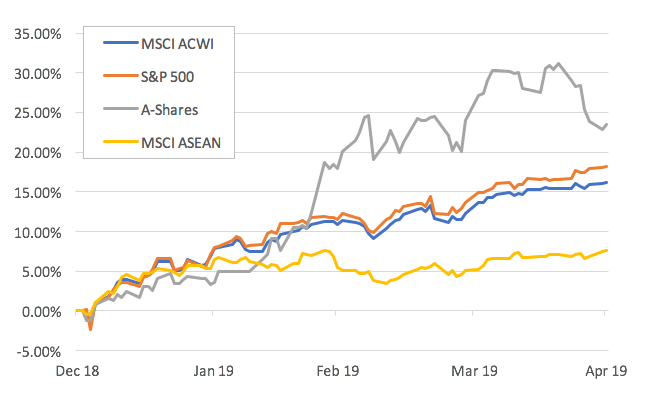 Figure 4: YTD underperformance of MSCI AC ASEAN Index Source: Bloomberg
-
With 40% of MSCI China and 100% of A-shares having reported Q1FY19 results, the weighted median company ‘beat’ was 8%+ and the best quarterly results since Q2FY18, although this follows-on from Q4FY18 where profits fell 44% YoY. These robust results will support Chinese equities as the market offering the best EPS growth of any major market this year at +11% and these may be revised up as tax cuts, boosting profitability and consumption, started on 1st May. Outside of China, early AXJ/EM results have been quite mixed and the bias overall is disappointing so far.
-
May will be a key month for elections in Asia ex-Japan. We get results in Thailand on the 9th (there is a risk they are annulled), Philippines Senate elections, Indonesia by the 22nd – Jokowi is likely to win by 8-10% and that is positive for local equities – and India on 23rd. Of these, the Thai and Indian elections have binary implications for markets – the risk for India’s risk assets, and INR, is the BJP loses substantial ground (in UP it may lose 48 seats to end up with 30 of the 80 seats in the lower house) that it can only form a weak coalition government dependent on unreliable regional parties and that Modi is replaced as Prime Minister.
Fixed Income
-
Sovereign rates were largely driven by economic data in April. A mixed bag of results over the month saw UST yields trade within a 20bps range throughout the period. However, the UST yield curve shifted upwards from the belly of the curve all the way to the long-end, thanks to support from strong manufacturing PMIs at the start of the month. Larger shifts were seen in the long-end, with the 10y and 30y yields rising 9.7bps and 11.4bps MoM respectively (Figure 5). This led to the yield curve steepening, with the 2y/10y spread rising from 14.3bps at the end of March to 23.6bps by the end of April. Similarly, the 5y/30y spread rose from 58.1bps to 65bps while the 3m/10y spread rose from 1.7bps to 8.5bps.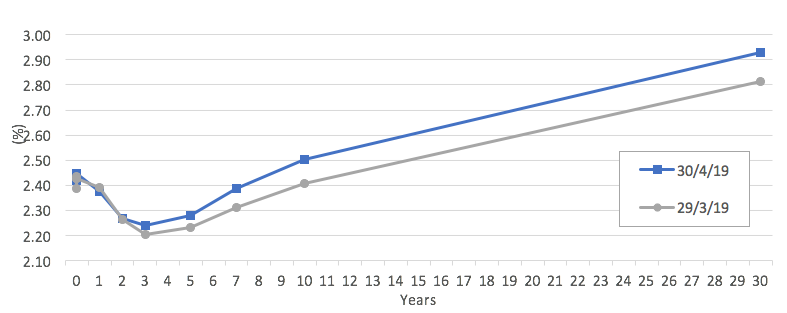
Figure 5: Upward shift in the yield curve in April Source: Bloomberg
-
European sovereign yields also received a boost at the start of the month after a stronger Chinese manufacturing PMI raised hopes that Europe will benefit from a stronger Chinese economy. However, mixed data thereafter led the Bunds yield to repeatedly test the 0% level through the month. There was only one instance of a significant break above the 0% level after better-than-expected economic data, but the yield failed to sustain the break and fell back towards the 0% level. Bunds yield ended the month 8.3bps higher MoM.
-
US high-yield (HY) was the best performing FI sector. US HY debt gained 1.42% MoM in April amid a supply shortage. Issuance in April was at $17bn – the lowest YTD. According to Bloomberg, most deals were oversubscribed, by multiple times with almost all trading above the issue price. April also saw the first PIK offering, hence suggesting that investors might be beginning to be more open to riskier assets and possibly explaining why the CCC space (+2.03% MoM) was the best performing sector within US HY (Figure 6).
Figure 6: CCC outperforms all other HY sectors Source: Bloomberg
-
Trade tensions could well see 10y UST retest the YTD low and key resistance at 2.30% after breaking below the 2.50% support post-Trump’s tariff threats. Likewise, Bunds 10y yield might go back into negative territory – not least if the US imposes auto tariffs in next week or so.
-
There are two major areas of concern in credit should a recession occur and default rates rise, with the first being the huge amount of debt (c$2.2trn) in the BBB space that accounts for 50% of total US IG outstandings. Some are speculating up to $1trn of this is vulnerable to being downgraded to junk that would be disruptive given existing HY FI outstandings of around $1trn. CLOs are the other area of rising concern given that the amount issued is similar to HY FI after huge new issuances in the last two years, but the danger is much of this is poorer quality paper (84% is covenant-light) by highly leveraged companies often (over 6x EBITDA). In contrast, HY FI credit fundamentals are improving as companies deleverage, reduce new issuance and use new debt to refinance more expensive, older debt.
-
We continue to highlight, in contrast to the perception EM FI is riskier, that the better credit fundamentals of EM FI – be it sovereign or corporate credit – are being underestimated. EM has lower debt to GDP than DM while EM corporates are deleveraging faster than DM corporates. Debt servicing drivers are also stronger, and demographics are superior to DM where the latter face genuine risks of unsustainable fiscal deficits in the future from unviable pension obligations and entitlements and limited political will to tackle the unpopular choices to rectify the imbalances. We remain positive, structurally, on EM FI with our preferred exposures in shorter duration EM HY FI. We would not chase it should spreads fall further but are comfortable collecting the coupon.
FX
-
Volatility in the G7 pairs recovered slightly in April due to AUD and GBP. The Fed continued to remain dovish however the dollar continued to display strength on the back of strong housing and employment data. The DXY traded to a 2-year high of 98.33 on the 26th April, breaking a resistance of 97.70 and is currently maintaining at this level. The biggest winners in April were EM currencies as investors were attracted to yields.
-
At the beginning of May, the trade-spat spooked investors. This caused indices to dip lower and JPY to strengthen as investors looked for haven assets. April remained a quiet month except for this, along with AUD and GBP.
-
EUR continued its long-term downtrend this month against a stronger USD as traders focused on disappointing industrial data from Germany and strong US consumer data. EUR ended April flat at -0.03%.
-
Within a 52-week range, CFTC reports show the EUR remains the largest net short hold with JPY and CHF near their largest net short hold. MXN remains net long as investors seek returns from interest rates. 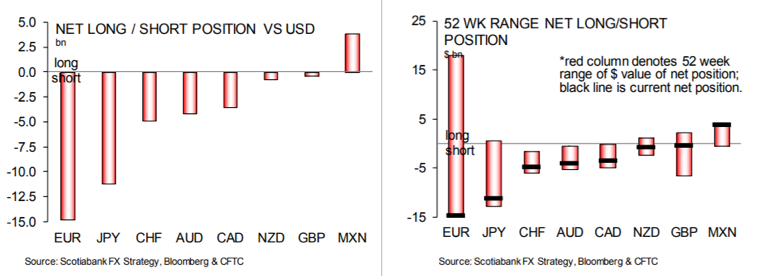
Figure 7: CFTC 52W net-short positions
-
DXY broke out above resistance at 97.50 to climb above 98 and a test of previous strong resistance at 100.50 was on the cards but recent events have seen it retrace back to 97.50 acting now as key support. The underlying trend for DXY remains up still and so a retest of 100.50 level remains the base case. We are USD ‘bulls’ until it is evident we should not be – not least because most other DM currencies all appear to be less liked be it housing crises weakening the CAD and AUD; weak data impacting EUR and JPY; political headwinds exist for several EM currencies.
-
We expect the EU-wide election to be the next major test of the EUR hovering around key support at 1.12 as strong gains by anti-populist parties could see it break below 1.11 and possibly test stronger support in the 1.07-1.08 range. On a more positive note, should the UK Conservative and Labour parties reach a bipartisan deal on BREXIT a likely stronger GBP would boost EUR and reduce economic risks.
-
Trade risks boost USD at the expense of EM/AXJ currencies, especially CNY, which has been rooted to around the 6.70 level for months but has now weakened and broke through a support at 6.75. However, the key support is the 200DMA at 6.86, which we expect to fail if a US-China deal falters or fails. A weaker CNY, arguably as important these days as USD for EM currencies, would pressure down AXJ/EM currencies at a time when many central banks, such as the Bank of Korea, are sounding more ‘dovish’ or acting as the Reserve Bank of India has.
Commodities
-
Brent continued its momentum from March and gained +11.87% before topping off and ending April +7.72%. Brent returned some of its gains as it failed to breach a key technical resistance of $75, thanks to Trump’s tweet and claim that he demanded OPEC to lower their oil prices. Oil is currently held by the 200DMA acting as a support at 69.24. We currently see a few factors in play against oil falling lower, but continue to believe these biases are overshadowed by the massive rate of which US shale oil is being produced.
-
We continue to expect Brent oil will trade in a range of $60-75/brl with upside capped by rapidly expanding US shale oil production and signs that Russia might be unwilling to follow Saudi Arabia’s line on OPEC+ quota discipline as it is wary of losing further market share and a slowing global economy. At the lower end, weaker prices would curtail some US shale output, while OPEC+ would become more sensitive to lower prices relative to higher numbers used to calculate fiscal budgets.
-
Gold ended the month flat, developed extensively in its technicals. Following the strength of USD, Gold had a tumultuous period in April. The next support is found at 1,253 after breaking its support at 1,293. We continue to see dollar strength on the back of higher USD real yields and therefore we expect gold to weaken relatively. The next support for gold can be seen at its 200DMA, 1,253.
-
On technicals, we see a head and shoulders variant of which the neckline, shown in red below (Figure 8), has recently broken. We believe that this trend will now act as a resistance.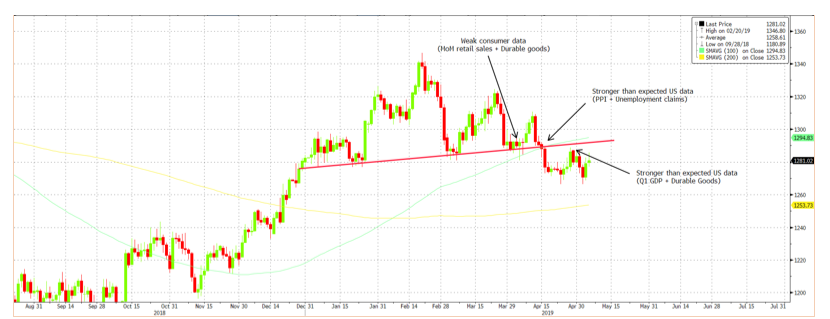
Figure 8: Gold prices see a ‘head and shoulders’ Source: Bloomberg
- Gold has been in a downtrend since testing recent multi-year highs at $1,340/Oz but appears to have found support at the $1,270/Oz level and may well be buoyed by trade tensions in next few weeks. One prominent sell-side house forecasts it will be back at $1,340/Oz during Q2CY19 and go through $1,400/Oz in the medium term as USD weakens and UST yields fall. It has been quite clear, of late, Gold prices have closely moved, inversely, to moves in USD and UST yields YTD and we expect this to continue.


