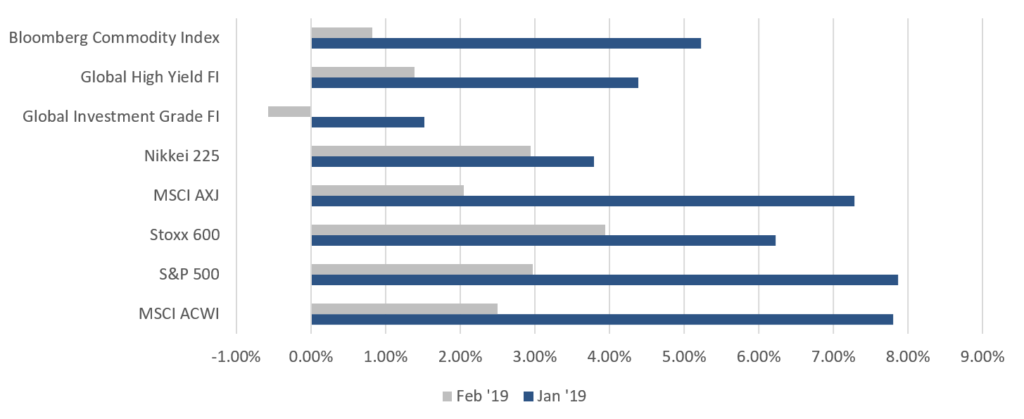
The rally for equities continues after the best January in over 30 years, defying the gloomy consensus seen at the end of 2018 as the S&P 500 (+ 3.0%), NASDAQ (+3.4%) and Dow (+3.7%) gained MoM alongside other major markets which were also up by 2-3%. The exceptions were UK’s FTSE 100 (+1.5%) on a stronger GBP, and a storming move up of 13.8% in China A-shares, including a one-day jump of 5.6% which happened just last week. The week was also the best gain for the index in over four years, as domestic investors’ ‘mojo’ started to reappear (see more below) following last year’s bear market. Stoxx surged 3.9% – in part from very oversold levels – but also helped by a weaker EUR and reduced trade war fears. The S&P 500 beat lowered earnings consensus forecasts for 4Q18 by over 3% to record 13% earnings growth YoY, but elsewhere results were more mixed – Some markets in Asia ex-Japan such as Singapore and Malaysia, instead suffered meaningful earnings contractions. Nikkei’s 3% rise was supported by record share buybacks in corporates’ guidance post-results.

Fig 1: Risk asset performance in Dec ’18 vs Jan ’19 Source: Bloomberg
We are increasingly positive on Chinese shares, whether offshore or A-shares. We like the attractive valuations, proactive policy action, fiscal expansion, PBoC’s easing and improving earnings forecasts in contrast to other large equity markets which are mostly experiencing weaker earnings forecasts, slowing GDP and more limited fiscal expansion. Our base case remains a Sino-US trade deal will occur – most probably in Q2 – and this should underpin CNY below 7.00 if not push it to strengthen further to 6.50 by YE19.

Fig 2: Normalized 10Y chart of SHASHR against the HSI Source: Bloomberg
We are becoming more cautious overall after equity markets and other higher risk assets (such as lower quality HY FI), have rallied strongly from Xmas eve lows. This has taken S&P 500 valuations back into expensive territory, and most other equity regions to fair value from inexpensive – bar PRC equities that remain attractive. Likewise, the rally in credit, with spreads tightening across the board but more so for HY (CCC’s especially) and EM FI, has moved most areas of FI back to fair value whilst sovereign DM FI continue to offer unappealing risk-reward ratios. We see the huge increase in supply of US treasury issuances driving yields higher, with 10Y UST yields testing 3% during 2019. We think that the upside from a likely Sino-US trade deal is mostly priced-in, whereas the risks from an equally likely US imposition of tariffs on global auto imports – at some point in Q2 – is being ignored. We believe that the adage “it is better to travel than arrive”, will apply to the Sino-US trade deal as there is a high chance it will be a partial deal, leaving scope for plenty of future uncertainties as we are only at the cusp of a wider strategic confrontation between the two superpowers.
On a fundamental basis, traditional drivers of risk assets (growth in earnings and GDP) continue to be downgraded (the exception being upgrades to PRC earnings forecasts), and we doubt these will stabilise until 2H19 with 1Q19 set to be quite disappointing. Other positives are also increasingly discounted by markets, namely reduced fears over a Brexit ‘no deal’ outcome, pension reforms in Brazil and a more ‘dovish’ Fed. Admittedly, not all is gloomy as positioning remains light on several indicators, including above average cash levels according to BAML’s PMS survey of the largest global allocators.
We are also seeing offsetting policy action by some governments, notably PRC, increasing fiscal spending, and some central banks turning more ‘dovish’, including the Fed and PBOC, with ECB widely expected to turn more ‘dovish’ too. As a consequence, we have been raising cash and cash equivalents across portfolios and will continue to do so should markets rally further.
Equities
- Trump declared a national emergency over the ‘wall’ in a bid to allay his support base that House Democrats are challenging. Last week we also witnessed the Trump-Kim summit which ended abruptly on an impasse, resulting in both parties going home empty handed without a deal.
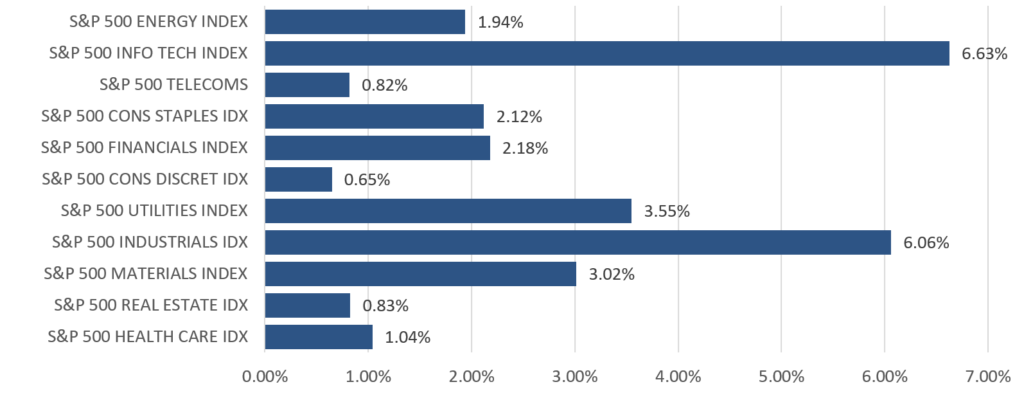
- US equities continued up from Jan’s recovery, with all three benchmark indices ending the month firmly positive as IT (+6.63%) and Industrials (+6.06%) led gains in the S&P 500 (+2.97%), while the Dow and Nasdaq were up 3.67% and 3.44% respectively. Markets were also somewhat sated after Powell reiterated the FOMC’s patient approach and sensitivity to capital markets, but also that the Fed would hold a much larger balance sheet than it did pre-crisis.

Fig 3: MoM moves across S&P 500 sectors Source: Bloomberg
- S&P 500 has reported earnings for 4Q18 – 72% of companies have beat estimates to an aggregate earnings surprise of 3.59%, while the aggregate growth rate of earnings came in at +13.07%, in-line with the estimate of +12.10% at the end of FY18. Unsurprisingly, elevated oil prices helped the Energy sector to the highest earnings growth of all, at +93.5%.
- For 1Q19, the aggregate analyst prediction is a -3.2% decline in earnings. MS has warned that FY19 could see a possible earnings contraction after a string of forecast downgrades, trimming their own estimates for FY19 EPS growth to just 1% from an earlier 4.3%. The house maintains their S&P 500 price target of 2,750 at YE19. Consensus FY19 EPS (Earnings Per Share) growth is estimated at +5%, but there remains a risk of an overall contraction although analysts see a recovery from weaker H1 earnings by Q4 coming from an easier base of comparison.
- European equities saw broad-based gains, with the Stoxx 600 climbing 3.94% in the month. Materials (+7.26%), Chemicals (+6.07%) and Insurance (+6.19%) led gains across sectors, while defensives like Utilities (+0.27%) and Telecommunications (-0.01%) were visibly weaker. Real Estate (-1.76%) was the only sector to see a decline.
- Stoxx is being torn by upside from relatively cheap valuations against the S&P 500, and its far worse economic performance that could result in an earnings contraction. EU SMEs are more vulnerable to a weaker economy, but could rally in the short-term if ECB becomes more supportive. EU will be especially impacted if US imposes auto tariffs that would hit the large EU auto OEMs hard. Our base case is Trump will impose tariffs, if more to appease his support base, but would lift them quickly to avoid damaging the US economy – a bit akin to NAFTA.
- Shares in Asia trended higher on optimism around trade, as rhetoric (mostly from the US) and sentiment on a near-term trade deal grew increasingly positive particularly toward month-end. The MSCI Asia ex-Japan’s +2.05% MoM gain was completely overshadowed by the run up in China A-shares (+13.91% MoM), which have surged over 20% from early Jan lows into a technical bull market.

Fig 4: SHASHR outperformance against other indices in Asia Source: Bloomberg
- The Nikkei also managed to climb 2.94% last month, but on the back of a weaker JPY which saw the index only up +0.62% MoM in USD-adjusted terms. GDP growth in 4Q18 came in at 1.4%, with IMF forecasts pointing to a further slowing of economic momentum in ’19. Corporate profitability has, however, stayed near record levels, and risks around deflation have decreased significantly.
- Over the course of this month, the delay of trade tariffs were confirmed, alongside subsequent reports which pointed toward substantial progress in the ongoing negotiations with March 27th now being suggested as the tentative date for Trump and Xi to sign off on a deal. However, the US’ point negotiator Lighthizer did temper market expectations later in the month, commenting that ‘much still needs to be done’ before an agreement could be reached.
- We see a lot of good news discounted by gains in Asia ex-Japan and EM equities YTD, with valuations of MSCI Asia ex-Japan back at historical levels and earnings forecasts still coming down. Given this, there is a stronger case to turn more defensive and move tactically into cash. An exception – see above – might be A-shares, as opposed to a number of H/HK shares looking more vulnerable now.
Fixed-Income
- US Treasury yields traded within a tight range for most of February before better-than-expected 4Q18 GDP numbers led UST 2Y yields to end 5.65bps higher at 2.51%, and UST 10Y yields to end 8.67bps higher at 2.72%. The yield curve saw a parallel shift downwards across the 2Y to 10Y period, with the 2Y10Y spread increasing by only 3bps over the month. Technically, UST 10Y yields found support at 2.63%, having failed to break below the level despite testing it four times.
- European sovereign bonds were mixed. Bund yields saw weakness throughout the month following multiple weak economic data releases, hitting a low of 0.08% before ending the month at 0.18%. Strong demand for new Italian and French debt issuances followed a series of strong European sovereign bond sales this year.
- PIMCO and CS both expect UST yields to rise in order to absorb the massive extra issuance needed to fund the fiscal deficit, with both expecting UST 10Y yields to reach 3% in 2H19. Foreign buying is impacted by a high cost of hedging USD, effectively eliminating most of the nominal yield pick-up available.
- The Fed may have erred by switching from being too ‘hawkish’ in Oct last year to being too ‘dovish’ following the Q4 swoon in capital markets. With the US economy seemingly still in rude good health and markets having recovered, there lies a growing possibility that the Fed might surprise complacent FI markets by reasserting its 2 rate hikes in the ‘dot plot’ guidance, even if technical factors instead support an end to balance sheet reduction.
- There is polarisation around whether to move up the credit curve to avoid a coming credit crisis. To some extent, this is linked to recession risks over the next 12-18 months. Those who doubt this would prefer the risk-reward in HY and EM FI. What is worth noting, is that PIMCO thinks the rating agencies are far too optimistic with their ratings, plus we know the majority of issuances are covenant-lite, and that reduces recovery rates.
FX
- FX volatility has fallen significantly, with the DXY barely moving and most other currencies stuck in their respective trading ranges. GBP, AUD and JPY were the exceptions.
- USD – January’s dip was compensated by gains in a risk-on environment as political tensions eased up. Overall, there are mixed sentiments for the dollar as investors juggled between Powell’s dovishness and positive US economic data.
- JPY weakened sharply against the USD last month to test, and weaken through, key support at 111.50, as the BOJ reiterated its accommodative monetary policy stance, macro data disappointed and concerns grew about global auto tariffs which Japan would be significantly impacted by.
- The EUR touched a monthly low of 1.123 on fears of auto tariffs. ECB and others, as IMF, have revised growth projections lower to 1.7% for 2019. The EUR has shifted its trading range from 1.13-1.18 in to 1.125-1.15, weighed down by potential snap elections in Italy as well as Spain. Brexit also weighed on the EUR.

Fig 5: GBP moves on Brexit Source: Bloomberg
- So far this year, Brexit has seen the GBP trade in a wide range of 1.27 to 1.33. It started the month at 1.310, traded to a low of 1.277, but ended the month at 1.326, on increased hopes a ‘no-deal’ option will be rejected by Parliament. It recovered above its 200DMA at 1.30 after falling below this level earlier in the month. Markets are currently pricing in a potential second referendum, which will add strength to GBP. 1.33 remains a key resistance level.
COMMODITIES
- Brent crude gained 6.69% through the month, breaking through its key resistance at US$64/bbl on continued commitment to production cuts from OPEC+. Prices were also supported by reports that the group could move toward a more formal agreement, which could see the cartel control 66% of the global supply of oil and over 90% of spare capacity.

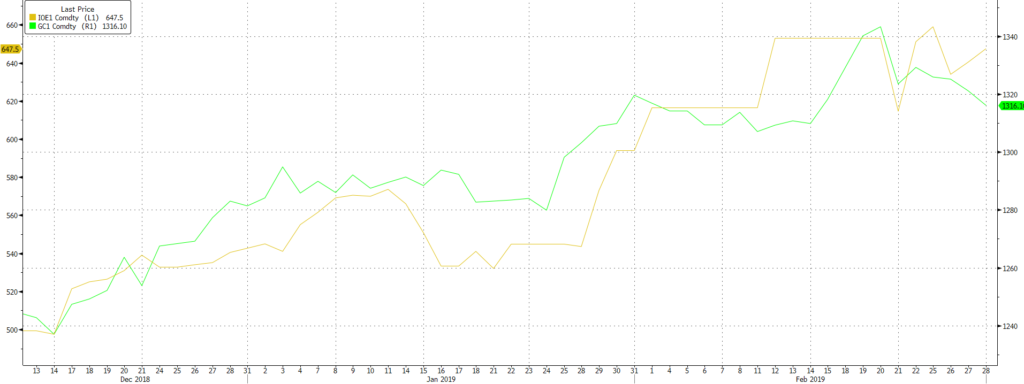
Fig 6: Gold (green line) tapers off, while Iron Ore (yellow) hits all-time high Source: Bloomberg
- Gold broke out earlier this month to test a high of US$1,346.71 /Oz, but failed to test the key resistance level just above $1,360/Oz. It then fell sharply thereafter on a combination of profit-taking and rising UST yields, alongside a stronger dollar which weighed on the precious metal. It broke through support levels at $1,320 in late-Feb, and $1,300 in early March to where it is currently testing the next key support at $1,280.
- Iron ore hit its all-time-high after the Vale mine disaster abruptly tightened global supply, whilst PRC’s implicit ban on Australian coal imports created movements in thermal and coking coal and again, highlighted the dangers of being a major supplier to PRC as the ban was linked to Australia’s decision to exclude Huawei as a supplier to 5G telephone systems on national security grounds.
- We remain constructive on oil as we believe there are supply-side restrictions that will underpin prices above $60/brl for Brent. The super OPEC+ cartel will have much greater pricing control than OPEC did, and thus will more easily be able to counter rising supply from US shale oil production to retain their status as a price leader. US shale oil producers will remain a force – just this week, both Exxon and Chevon said that they would triple oil production by ’23 at their respective Permian basin fields. It is material as Exxon expects to produce over 1m bpd by then, with Chevron not too far behind.
- Another support for oil prices is the continued capex discipline of the large, integrated oil companies, as spending remains 40% below the peak in 2014, with estimates that it will rise just 5% this year. If this continues, there is a genuine risk of a supply crunch by as early as next year that could see oil prices jump to over US$90/bbl.
CONTACT
We would be more than happy to have an informal chat about these and the other services we offer as well as the current opportunities we are looking at.
