Market View
The equity markets have been buoyant for the last 6 weeks. Global virus cases have peaked and many countries have started a tentative process of loosening lockdown restrictions. To assist the recovery, G20 countries have announced a stimulus program that is equivalent to 9.3% of combined GDP, notably supported by close to zero interest rates. This level of stimulus is unprecedented.
On the other hand, we have almost total cessation of activity in very large swathes of the global economy, particularly in the service industries that constitute 65%-75% of GDP for Europe and the US. This sector employs a similar level of the workforce. US unemployment has already reached 14.7% with a 2% lower participation rate. Unemployment rates in the US and Europe are expected to peak in Q2 with significant recovery by year end. Whether the current valuations of the equity market are justified depends on the speed at which lockdown measures are removed and how rapidly the global economy normalizes.
In the last three recessions, it has taken an average of approximately 4 years for earnings per share and the unemployment rate to reach the previous peak. This is clearly not what the market is expecting with the huge stimulus in place. The 2021 estimated PER for the S&P 500 is close to 18x, approximating the highest level for the last 5 years and a level that hasn’t been breached since the Dotcom boom, twenty years ago.
Muddying the situation is that famous brands that are weathering the lockdown well are at all-time high two year forward PERs. We all know of the usual suspects that have benefited from the lockdowns such as Netflix and other online businesses, as well as pharmaceutical companies share that have skyrocketed due to their work on a vaccine. However, some of the largest consumer discretionary companies that have been negatively affected by the virus, but are expected to bounce back strongly, are also at highly elevated valuations. This is in contrast to those businesses seen as the most vulnerable to the virus where valuations have plummeted. Unlike previous deep recessions, the high-quality businesses you want to own for the long term never really became cheap. As Warren Buffet recently lamented “we don’t see anything attractive to do”.
We have entered the statistically weaker May-Oct period for equity markets. So far, sentiment has been buoyant due to prospect of lockdown restrictions loosening. The market is like a prisoner getting excited at the prospect of getting out of jail. However, once we are out, reality will set in and the hard slog of getting back into a normal life begins. There will be times when we wonder why we were so excited, and for many, finding a job in the real world will be very difficult for some time.
The US market bounce from the bottom has been rapid. From its March 23 trough, the S&P 500 has taken just 26 days to regain 60% of its previous peak after the 34% fall. Following the 2008 GFC, it took 373 days to reach this level of recovery. Perhaps, this is a tough comparison since the market fell 57%. The closest in terms of peak to trough fall and the speed of the fall was the 1987 Crash when the market fell 33% in the space of days, but then it took 469 days to recover 60%. The fastest recovery before the current situation is the 1990-91 recession. Here, the peak to trough was only 20%, but the 60% recovery was reached in 111 days. The market appears to be expecting that the huge stimulus package, zero interest rates, and the fact that this recession was caused by government actions specific to the Coronavirus and therefore, can be undone by the reversal of those policies, to be the game changers.

Figure 1: Market Crash Comparison Source: Bloomberg, Odyssey Capital
Where is the Value?
The speed of the equity bounce was a surprise. What should not have been a surprise was the transient nature of the huge spike in equity volatility, the level of which rivalled the GFC. That was an excellent time to be short equity volatility in structured products where you were overly compensated for risk. Now that the volatility opportunity has faded, what are the current opportunities?
On a relative basis, valuations for Asian and European equity indices are close to their nadir relative to the US. While European equities show the same symptoms as the US market where resilient quality businesses are priced very expensively, the same characteristic does not appear as prevalent in Asia. For the latter there are still quite a few quality businesses we’d like to own for the long term on historically modest valuations.
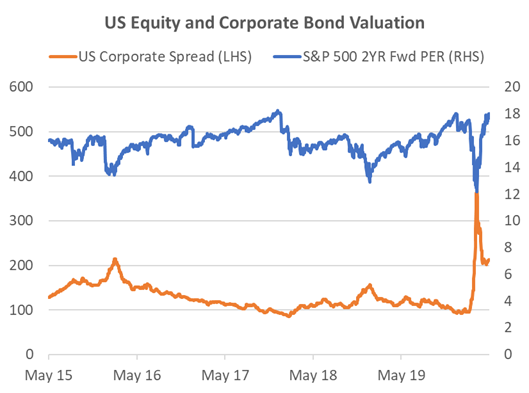
By asset class we still prefer fixed income. While the US investment grade indices are already back to where they were at the beginning of the year, BBB spreads remain close to 100bp wider. US high yield (HY) is still trading at a wide credit spread of 720bp, implying a 5yr default rate of approximately 50%. Since the majority of US HY bonds are issued by listed companies, what does it say about the equity value of those companies? What many equity investors may forget is that there is contractual obligation for a company to repay that bond and the interest, and if they do not pay, bondholders can force a liquidation of the company. In such a case, equity holders rank last to receive money, if there is any left. Often, there is not. This payment ranking system is the reason why in a crisis situation corporate credit generally outperforms equity by a wide margin. However, in the last couple of weeks, equity has roared ahead while bond spreads have remained stagnant. This suggests there is a disparity between the corporate risks that bondholders perceive, particularly for high yield, and those that equity holders perceive.

Figure 2: US Equity and Corporate Bond Valuation Source: Bloomberg, Odyssey Capital
In alternatives we also note that some managers are creating new funds to take advantage of the current dislocation in markets, particularly in the private credit space. These provide significant interest. However, we remain a little cautious of ongoing vehicles that have yet to mark down their investments to account for the current business environment. Private investment valuations often show little correlation to the public markets. The only time that changes is when the real economy is affected significantly. Then the correlation is very high, even though it is revealed on a lagged basis.
If you like to receive more information on our portfolios solutions, please contact us here: info@odysseycapital-group.com

