
Sep 5, 2019 | Uncategorized
As Japan continues to experience exponential growth in tourism, tourists are more frequently leaving the major cities and venturing out into the various islands, hidden away prefectures and charming outer regions. Fukuoka prefecture, in the southern part of Japan is where Odyssey has its first planned historical building acquisition, specifically in the port town of Port Moji. Odyssey’s strategy to acquire and convert this one-of-kind historical building with the help of famed interior designer Hashimoto Yukio, will create a stunning boutique hotel that will support the recent gentrification of the area and the city’s rise as a popular tourist destination.
It is also encouraging to see that Odyssey’s efforts, coupled with Hashimoto’s clout, will have an effect on the prefecture as a whole and not just the town. As seemingly never-ending numbers of international tourists flock to Japan’s shores and domestic tourists continue to explore their beloved homeland, its no surprise that the industry is thriving and expanding to all corners of Japan.

A recent broadcast on the NHK television network on the Japan Railway Journal named ‘Nishi-Nippon Railroad: Fine Dining on an Even Finer Tourist Train’ is an insight into the potential for growth in the tourism industry in the under-marketed and under-invested regions of Japan. In March 2019 the Rail Kitchen Chikugo opened a route which ends in the town of our future acquisition – Port Moji; this route lets tourists see more of the prefecture of Fukuoka while sampling local cuisine on the way. The news broadcast reveals how much tourists thoroughly enjoy the experience and Port Moji.

The unique tourist experience mentioned above is another reason why the Japanese tourism market continues to grow and expand across Fukuoka and, indeed, the country. Odyssey’s strategy continues to be to identify growing areas and work with local experts and talent and we see this news story and the new railroad as yet more confirmation of our predictions and winning strategy, as Port Moji’s growth into another amazing tourist getaway continues.
If you would like to see the entire story please watch the video here –} 
For the specifics of Port Moji please jump to 22:30 in the video.
Aug 22, 2019 | Articles, Global Markets Update
Last week saw the heaviest sell-off in the S&P 500 (the worst since Dec ’18), with US indices seeing sharp pullbacks into early August just shortly after making fresh all-time highs in the last week of July. A re-escalation of Sino-US trade tensions, as well as a pullback in rate cut expectations (with market expectations of a rate cut cycle against Powell’s comment that this month’s move was more of an ‘insurance’ cut), were key factors contributing to the decline in risk-on assets. Likewise, weaker-than-expected data releases globally added to concerns over the state of the global economy, bringing oil down below its key US$60/bbl support despite the worsening relations between the US and Iran. Economically, the US continued to display relative resilience compared to most other major developed markets, understandably outperforming as the S&P 500, Dow Jones and Nasdaq gained 1.31%, 0.99% and 2.11% in July. This was in comparison to the Stoxx 600 (+0.23% MoM) which was buoyed by better-than-expected (albeit heavily downgraded) earnings releases, and Japanese equities in the Nikkei 225 (+1.15% MoM) which saw a pretty decent month. The MSCI Asia ex-Japan (-2.17% MoM), however, underperformed significantly as Chinese equities tumbled on weak data and the trade spat, with A-shares falling -1.55%, and amid the ongoing protests in Hong Kong which undoubtedly weighed on the HSI (-2.68% MoM). The YTD rally in Indian equities also came to an end, with the Sensex (-4.86% MoM) coming off all-time highs to be the underperformer for the month.
What was mostly a calm month for currencies (with the exception of Boris Johnson’s election and steep moves in GBP) soon turned into a storm after Trump surprised markets with his additional imposition of tariffs on Chinese goods. The DXY surged to a YTD high of 98.900 on Powell’s comments before retreating back to 97.220, while in early August, retaliatory moves by the PBoC saw onshore CNY quickly fall below the key psychological Rmb7.0 level. Prior to that, the Euro was mostly led lower by a weaker Sterling on renewed hard Brexit concerns and Boris’ loss in the by-election which nipped away at whatever was left of the majority vote that he had.
Outlook
The sudden shift in sentiment brings back memories of the plunge in Q4CY18, and in particular, the heavy selling during December towards Christmas Eve. Markets have discounted much of the good news – from better-than-expected (albeit post-downgraded) earnings, the ‘dovish’ pivot by the Fed and global central banks, the trade ‘truce’ as well as a moderation of geopolitical risks in the short-term – to the point that Morgan Stanley thinks 22 other central banks will join the Fed in cutting rates by YE19. H2CY19 will potentially be much rougher as geopolitical risks are rising with 1) a ‘no deal’ Brexit 2) dysfunctionality in Spain 3) Italian opposition to EU’s fiscal rules and a possible election giving Salvini control 3) greater Russian adventurism 4) a brutal crackdown on HK’s protesters 5) rising tensions around the South China Sea, Taiwan, 6) worsening tensions between Korea and Japan and 7) rising tensions in the Middle East alongside 8) the instability of Trump.
We have deliberately held an underweight equity positioning and high cash levels for much of this year, more so since April and that worked in May but was impacted by both Powell’s end-May ‘pivot’, and renewed hopes of a trade ‘truce’. We stuck with our defensive positioning as we feared that the optimism in markets (not least as Forward P/E’s on the S&P 500 pushed through 17.5x) was not justified, although the Fed U-turn in November despite robust macroeconomic data (in particular, consumption) caught us out. I see the potential for this correction to run c. 10-15% more, with the S&P 500 re-testing 200DMAs at 2,770 as other, more trade-vulnerable markets to suffer more. EM/AXJ markets are more at risk, not just to trade-related damages, but also to a stronger USD. I struggle to find enthusiasm for US Treasuries, having missed the rally and as the yield on 10Y US Treasuries, below 1.8%, are giving you a negative real interest rate & prefer cash. Our trades into gold found vindication (clearly Bitcoin would have been better!), but we doubt that prices can run much further through key resistances at $1,450-60/Oz.
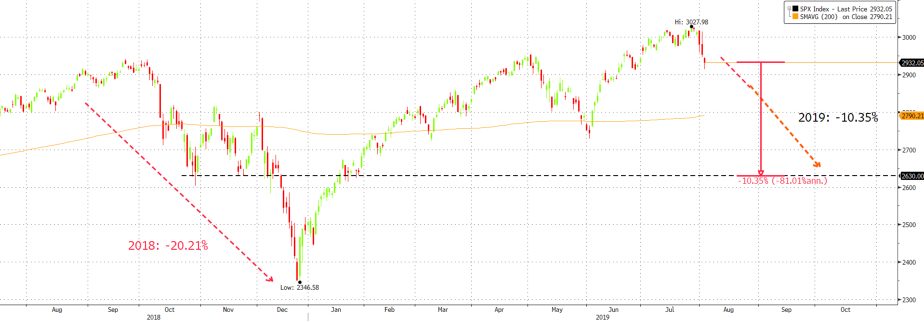
We remain cautious around risk assets and prefer holding cash in USD. Any major correction offers a trading opportunity to rebuild riskier assets – notably quality equity franchises as Visa or Diageo. In the near term, we could see volatility spike up across most asset classes. Helmets on. The elixirs that could soothe markets might also bring about some damage to capital markets; the Fed moving into a rate cutting cycle; Trump, fearing his trade policies might cost him the election, could ease off on tariffs on China; Powell’s complete U-turn in monetary policy despite US macro data remaining solid, can only be explained by a pandering to please capital markets. On this note, any fall of 10%+ (as we saw in December last year) will likely move a Powell-led Fed to exercise the ‘put’ option that markets expect. This probably sets the lower range of any selloff in the S&P 500 to around 2,630 – 2,770 (Fig 1), which is not unlikely given our expectation of both earnings & GDP downgrades, as well as potential damage caused by trade tensions and geopolitical worries.
![]()
![]()
![]()
![]()
Fig 1: SPX projected to test a mid-term support of 2,630 Source: Bloomberg
The US, The Global Economy and Powell’s ‘Put’
US GDP data is always distorted between Q1 and Q2. It is clear the huge jump in 2Q19’s consumption numbers after a weak Q1 was in part carried over from the previous quarter (the US government shut down may have had an impact) but nonetheless, it was robust and reflects solid consumer sentiment surveys. Q2 was also impacted by destocking in inventories that had boosted Q1. By stripping these out, the likely underlying GDP growth in Q2 was c. 3% relative to Q1’s 2%. Government spending, buoyed by the Trump fiscal boost of $1.5trn, accelerated but this will slow down in Q3 and fall off a cliff by Q4CY19 as the new fiscal year kicks-in. Business fixed asset investments and net trade were negatives. All in all, this was a solid quarter underpinned by consumption, which accounts for 70% of the US’ GDP. The strength in consumption is at odds with the caution corporates are providing, via a negative-to-positive forward guidance ratio of 3:1 for H2FY19 earnings, and their reduction in capital expenditure. With unemployment at 50Y lows, accelerating wages (private sector wages, including perks, are rising at over 4% p.a.), low mortgage costs and confidence around job security; there is a decent argument that the consumer, assuming Trump leaves trade tariffs as they are (the next $300bn of US tariffs on Chinese imports would mostly hit consumer related items), will remain resilient in H2CY19 (the latest Conference Board survey was very strong). If so, then the ‘gap’ between consumer optimism and corporate caution (if not FI markets’ pessimism) might close in favour of the consumer, implying upside to US domestic demand, GDP growth and earnings growth in the S&P 500. Of course, the risks for corporates include a strong labour market (which will drive up employment costs more quickly and so impacting margins), along with trade-related damage and a higher USD.
For us, what is quite clear is that the Q2 GDP data, recent NFP, consumer sentiment surveys, and durables, along with US equity indices close to all-time highs, do not provide the reasons for the Fed to cut rates – indeed Professor Shiller rightly suggested the current conditions in the economy and capital markets support the argument more for a rate hike than the Powell ‘put’ of a rate cut we experienced. Clearly, the Fed is pandering to capital markets and the critic-in-chief, Trump. Resilient consumption and, as a result, better S&P 500 earnings, may support the index’s rally to break firmly through 3,000 (GS’s revised price target is 3,100), but it might limit the Fed to a one-off rate cut, boost inflation and underpin US GDP growth and USD. We continue to see more downside risks from rising geopolitical scenarios (‘no deal’ BREXIT, Iran confrontation, worsening Japan-Korea trade spat, South China Seas tensions, US’s possible sale of F-16s to Taiwan in Q4 which is a redline for China, political risks in Italy and Spain and risks around Turkey and South Africa). In addition, IMF recently cut global GDP growth forecasts in both CY19 and CY20, with the bulk of these downgrades coming from the BRICS.
Frankly, it is very difficult, we find, to have a strong conviction on the outlook and that means capital markets could be prone to violent, large moves and spikes in volatility as we have just seen. But with Nasdaq still up c. 15% YTD and double-digit gains in the MSCI ACWI, the odds suggest going more defensive in portfolios by reducing riskier assets like equities (with US stocks on expensive valuations), and high-yield FI (forecasted default rates are moving up), but we will be monitoring US consumption positives as well as the degree of monetary easing we get by the Fed alongside the other 22 central banks globally (MS thinks that they will cut rates by YE19). Our basic thesis is risk assets have discounted a lot of the positives yet are ignoring the negatives at a time when the rally in sovereign debt implies a dichotomy on outcomes – one, or other, of these two asset classes, will sell-off hard.
Re-escalation of Sino-US trade tensions
Last year, China’s move to allow the CNY to depreciate from 6.23 to 6.98 had ‘neutralised’ the initial 10% of US tariffs, a move which in part incentivised Trump to impose even hasher tariffs. Indeed, Trump made it clear that the latest 10% on the remaining $300bn of PRC imports (due by 1/9), could be increased to 25% or higher. Whilst China could likewise impose higher tariffs on US imports, it is running out of room and will thus need to find other ways to retaliate. It appears China is taking a tougher line since the earlier breakdown in talks earlier this May, and not compromising on core structural economic objectives. One line of thought here is that despite the trade war and with domestic reflationary policies perking up the Chinese economy, China is emboldened in its negotiating position. Another is that they can live with the ‘pain’ and wait for Trump to be replaced after Nov 20thby a more rational administration. Certainly, the narrative around this Sino-US trade war posits a decreasing likelihood that an accord will be reached before the next US election, with some suggesting that Trump sees a deal as potentially giving Democrats an opportunity to attack him. There are no signs yet, electorally, that the trade war is hurting Trump’s appeal. Having said that, 68% of the latest round of tariffed goods are consumer items, and should Trump increase tariffs significantly further from here, he risks alienating the voters and creating a recession – MS thinks if this extra $300bn of imports were to suffer a 25% tariff, the US economy would go into recession within 6-9M, coinciding with a key voting period in Q2 and Q3 when most make their mind up.
‘Weaponising’ the CNY has long been talked about by bears of the currency, but this has not happened, and most studies still see CNY as at fair value. However, the Chinese lack an obvious trade-related retaliatory measure, so they could, if angered, choose to devalue the CNY by another 5-6% (Fig 2). Fundamentally, China is moving towards both a trade and current account deficit – US surplus is the large exception – so it is not wrong to assume that the CNY might fall further. Bears argue that the currency should depreciate to 7.50-7.60, even 8.00, as this would ease pressure on PBoC from sticking to tighter monetary policy. The principal reason against a major devaluation is that the government rightly fears capital flight that, if extreme, could destabilise its financial system by creating a liquidity run. With capital controls and a stable currency, China can retain sufficient domestic liquidity to ensure that a solvency crisis does not deteriorate into a more damaging liquidity crisis. A major amount of capital fleeing China could force the PBoC to jack up rates precipitating a recession. Financial system defaults – given high corporate debt-to-GDP – alongside capital flight, would only increase the risks. We think it is unlikely that the PBoC and the Chinese government would take this risk, but where the line-in-the-sand is we do not know – it might be here at 7.00 or at 7.20. If we take 6.80 as an average point, then a 5% depreciation from there implies that 7.10-7.20 is feasible. Another factor against a rapid fall in CNY is that China prides itself in the relative stability of the currency, and the benefits that this carries for its vast trading complex. Lastly, if forecasts prove right and China moves into a trade & current account deficit, a weaker CNY would most definitely be negative. If this were to be the case, we would not be surprised if China accelerates its selling of US Treasuries given their YTD rally and the recent moves in CNY.
As the two sides’ trade confrontation spirals further into a toxic standoff, it will damage not just their own but the global economy as well; in doing so adding to more GDP downgrades, notably in the trade sensitive EU where feeble domestic demand and an underpowered ECB cannot offset trade weakness, as well as APAC. It also raises the stakes in that the Sino-US trade dispute is part of a wider strategic confrontation between the two that is just starting. The risks lie in a higher non-trade conflict (as with issues around the South China Seas or the US’ intent to sell F-16s to Taiwan), take on a greater life and further reduce hopes of a trade compromise.
Fig 2: CNH’s room to weaken to 7.35 Source: Bloomberg
Equities
-
The S&P 500 has once again failed to confirm a breakout above 3,000, and it could be that the rally ahead of the Fed’s expected rate cut was the ‘rumour’ helped by a better-than-expected Q2 EPS reading, albeit one that is tracking a negative two-to-three percent YoY earnings contraction for a second quarter in a row. Nonetheless, the correction thus far across US indices has been steep (Fig 3), while other markets are breaking 200DMAs as – in APAC – the STI, KOSPI, and the HSI with others heading there. ![]()
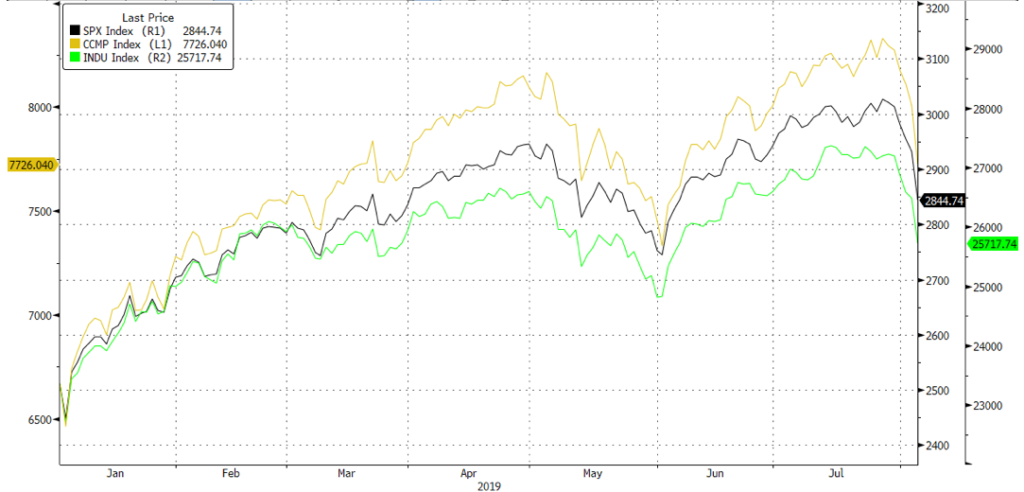
![]() Fig 3: YTD performance of US indices Source: Bloomberg
Fig 3: YTD performance of US indices Source: Bloomberg
-
Q1FY19 earnings for S&P 500 ‘beat’ the conservative consensus by around 3%, falling just -30bps YoY whilst 76% of the 77% S&P 500 companies that have reported Q2FY19 earnings have also ‘beaten’ conservative consensus estimates. Factset thinks that the companies which have reported so far – along with estimates for those to report – will see Q2FY19 earnings fall by -1.0% YoY relative to the -4-5% consensus estimate during the pre-results season. Year-to-date, S&P 500 EPS has been cut by -6.5% from YE18 estimates.
-
The same is true for Stoxx, where Q2 results are seeing a net ‘beat’ over significantly downgraded forecasts after Q1 results were out but will still likely be down -4% YoY on an absolute basis. There is ‘polarisation’ between where S&P 500 H2 earnings will go with consensus (and Goldman Sachs) expecting +3% (GS also forecasts +5% FY20E), which implies a double-digit recovery in H2 and especially in Q4FY19 where comparatives to the FY18 base look easier.
-
This is opposed to others like Morgan Stanley, who see a contraction in overall FY19 earnings, and think that earnings consensus for H2FY19 is way too high, and that might result in the S&P 500 correcting 10%+ as investors become more pessimistic. To the extent that the US consumer looks to be in rude health, the key to growth/contraction in FY19 earnings might lie in whether toplines hold up (helped by stronger consumption spending), and the degree to which corporate operating profit margins are squeezed. One lead indicator for future earnings are today’s sales growth and here the ‘weak-ish’ Q2FY19, in contrast to better than expected earnings ‘beats’, is a downside indicator into H2.
-
In APAC, our overweight positioning in Chinese equities (Fig 4)is starting to look a lot less clever as trade and a depreciating CNY hits the defensive domestic counters like Tencent and Alibaba, as well as preferred names in Real Estate and Financials. Our sense is thus a need to reduce exposures in this region. Meanwhile, domestic troubles are making Indian equities less attractive, while ASEAN is exposed to trade damage and USD strength.
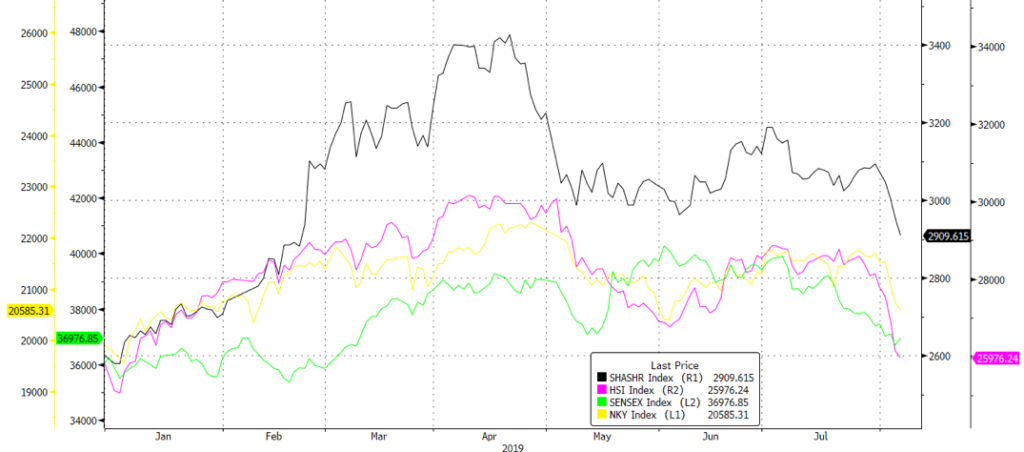 Fig 4: YTD performance of Asian indices Source: Bloomberg
Fixed Income
-
US Treasury (UST) rates were mostly flat in July. While the 2Y yield ended at 1.87%, 11.72bps higher MoM, the 10Y yield was mostly flat at 2.01%. However, yields tanked, and the UST yield curve flattened in the first two days of August after Trump announced the tariffs on additional Chinese imports (Fig 5). Weaker manufacturing data after also weighed on yields. Despite this, we remain convinced that the current economic conditions in the US do not warrant a monetary policy easing cycle.
 Fig 5: Flattening of UST yield curve Source: Bloomberg
-
German bunds yield trended lower throughout July, extending declines from June, as European economic data remained weak. The fall in German yields accelerated in the first two days of August as well, ending the week with the entire German yield curve in negative territory (Fig 6).
 Fig 6: Germany sovereign yield curve falls below zero Source: Bloomberg
-
EM debt was the best performer last month. EM hard currency debt, represented by the Bloomberg Barclays EM USD Aggregate index, returned 1.00% while EM sovereign local currency debt (LCD), represented by the Bloomberg Barclays EM Local Currency Government index, returned 0.98%. We continue to favour EM debt, particularly hard currency debt, relative to other FI sectors given the market’s hunt for yield in the current low-interest rate environment. We are more cautious around LCD, especially given the strong dollar.
-
Within corporate credits, high yield (HY) debt generally outperformed investment grade (IG) debt (Fig 7). Both IG and HY index spreads are trading at the lower levels seen in ‘18, with the IG index yield trading at 2Y lows. With IG yields back at that level, we don’t think it justifies the inherent risks and thus prefer HY debt.
 Fig 7: HY vs IG returns Source: Bloomberg
FX
-
The DXY reached a YTD high of 98.90 last week but has since continued to fall since Trump’s renewed tariff threats. Previous resistance levels, bar the 103 peak in end 2016, can be seen at 100 (Fig 8). This is likely the next level of resistance if markets continue to back the dollar on the Fed’s less-than-expected dovishness. We have seen the DXY break through a key resistance of 98.50 over the last week, with support from its 200DMA at 96.93.
 Fig 8: DXY resistance at 100 Source: Bloomberg
Fig 9: EURUSD breaks below key support of 1.11 Source: Bloomberg
-
In our previous monthly, we noted that the flight to ‘safe haven’ currencies could be steep, should trade tensions escalate once again. They did, and we saw JPY gaining to 105.60. We expect haven currencies (JPY, CHF) to see continuedstrength, and for the Sterling to be exposed to the downside in lieu of Brexit uncertainty.
-
Citi’s broad NEER values show the Yuan dipping below 98 with speculation that China will further adjust its real effective rate lower to offset the impact of new tariffs. This will likely put downward pressure on Asian currencies as they adjust to accommodate this pressure. We see an opportunity in shorting the Thai baht, as a weaker yuan might release some of the latter’s strength which we saw in July.
Commodities
-
Last month, we noted a trading range between US$60-68/bbl, based off numerous factors including Trump’s pressure on Iranian production as well as a slowdown in overall demand from trade wars. In July, Brent saw a rise to US$67/bbl, helped higher by the continued momentum of production declines from June as well as an inventory decline for Cushing crude. Hurricane Barry also helped push oil prices higher by shutting down c. 1m bpd of production in the Gulf of Mexico. However, this rise was soon offset in a gradual build of inventory once again as exports slowed from a dip in demand due to trade wars. Short bouts of dollar strength from Powell’s less-dovish comments also helped push oil lower.
-
We adjust our trading range for oil to US$60-$65/bbl, with a bias to the downside, and see the $60 level as a support that may break by the end of Q3. We follow the 200DMA resistance level of $65 and note that the support at $60 has been tested 4 times since June. With the added tariffs from the US, as well as a retaliatory stance from China, we foresee that tensions are more likely than not to rise and this should further dampen the overall mood for risk, and therefore the outlook for global growth.
(Fig 10)
 Fig 10: Brent crude on a downward trend Source: Bloomberg
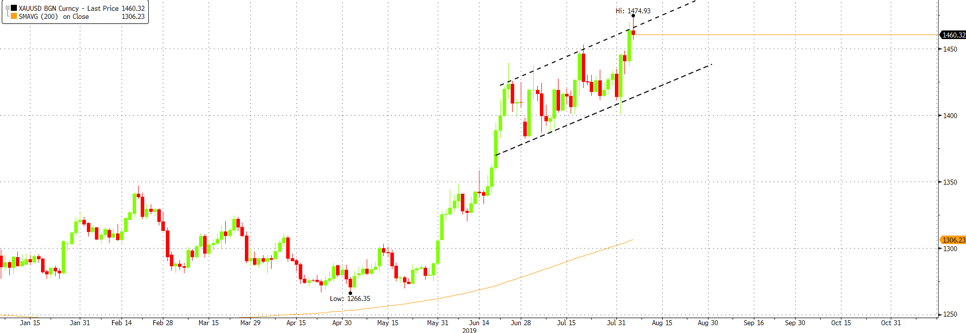 Fig 11: Gold’s upward channel Source: Bloomberg
-
The increasingly uncertain backdrop has and will likely continue to benefit the precious metal, with the potential for prices to rise above US$1,500/Oz. From a technical perspective, we view Gold’s momentum to be too strong for a “sell-off” reversal, similar to what we saw in equity markets.

Aug 21, 2019 | Press Releases, Uncategorized
Partnerships
Odyssey has recently partnered with New York-based Cadre, a technology-enabled real estate investment platform, to allow Odyssey’s private wealth management clients to invest in Cadre’s syndicated property opportunities.
Cadre leverages technology to make it easier and less costly for individual investors and institutions to buy stakes valued from just US$100,000 USD in institutional-quality U.S. commercial and multi-family real estate. Cadre’s investment opportunities target superior risk-adjusted returns with an emphasis on cash flowing real estate driven by differentiated sourcing, data-driven diligence, increased transparency and flexibility for investors.
Led by CEO Ryan Williams and a team of professionals from premier investment firms including Blackstone, Goldman Sachs, Morgan Stanley, Dune, and GEM Realty Capital, Cadre has invested in transactions totalling more than US$2.5 billion in transaction value since launching.
Through the partnership, Odyssey’s clients will be able to use Cadre’s platform to select institutional- quality U.S. commercial and multi-family real estate investments vetted by Cadre’s experienced team.
Odyssey’s partnership with Cadre highlights sustained interest by Asia Pacific based clients in accessing institutional-quality commercial and multi-family real estate investment opportunities in the United States.
About Cadre
Cadre is a technology-enabled real estate investment platform that provides qualified individuals and institutions access to fully vetted commercial real estate opportunities. Cadre enables investors to gain exposure to the asset class in a fee-efficient, transparent manner. Cadre has invested in transactions totalling more than US$2.5 billion in transaction value to date and has closed on more than US$130MM in corporate funding from backers including Andreessen Horowitz, Khosla Ventures, Ford Foundation, Thrive Capital, and General Catalyst.
www.cadre.com

Jul 9, 2019 | Articles, Global Markets Update
June was a robust month for risk assets with equities rallying on a more ‘dovish’ Fed that shifted from talking about more accommodation to Powell effectively telling markets the Fed will cut rates July – the question now being 25bps or 50bps, and whether it is ‘one and done’ or if there will be several cuts. US markets once again are at all-time highs and for the third time in under a year. US was the best performing region, with the S&P 500, DJIA and Nasdaq gaining 6.89%, 7.19% and 7.42% respectively over the month. This is relative to Stoxx’s 4.28% and Nikkei’s 3.28%. Asia ex-Japan (AXJ) also saw a strong month with MSCI AXJ recovering from May to gain 6.06%. The US-China trade truce, from G20 Summit, added cream to the outcome. Fixed income (FI) rallied strongly on the 100bps shift in Fed funds rate expectations but the underlying narrative here, of a much weaker GDP outlook, is hard to reconcile with the rally in equities and tight high yield (HY) FI spreads. Moody’s highlighted it raised its default rate forecast for the first time in some years that has negative implications for HY FI in 6-9 months. Asian FI spreads remained ‘tight’ too, with Asian USD HY index spread ending the month at 4.55%, and the Asian USD investment grade (IG) index spread ending the month at 1.35%.
We remain cautious towards risk assets with much of the good news – a Fed rate cut and a US-China trade truce – now being discounted by markets. We also believe the next few months may well be tougher conditions for equities and HY FI. US growth – not least nominal GDP growth – is set to slow sharply in H2CY19 although we doubt a recession will unfold (the chances of recession are much higher in both the European Union and UK in our opinion). We also see reasons for more downside risks in equities as earnings forecasts look too optimistic relative to the likely outcome. The topline and margins will likely face a squeeze, and this makes the current forecasts of S&P 500 earnings per share (EPS) growing +10% in the remaining six months of the year improbable. We share a similar conservative view as Morgan Stanley (MS) which forecasts S&P 500 could fall 10% this quarter as investors start to discount weaker fundamentals.
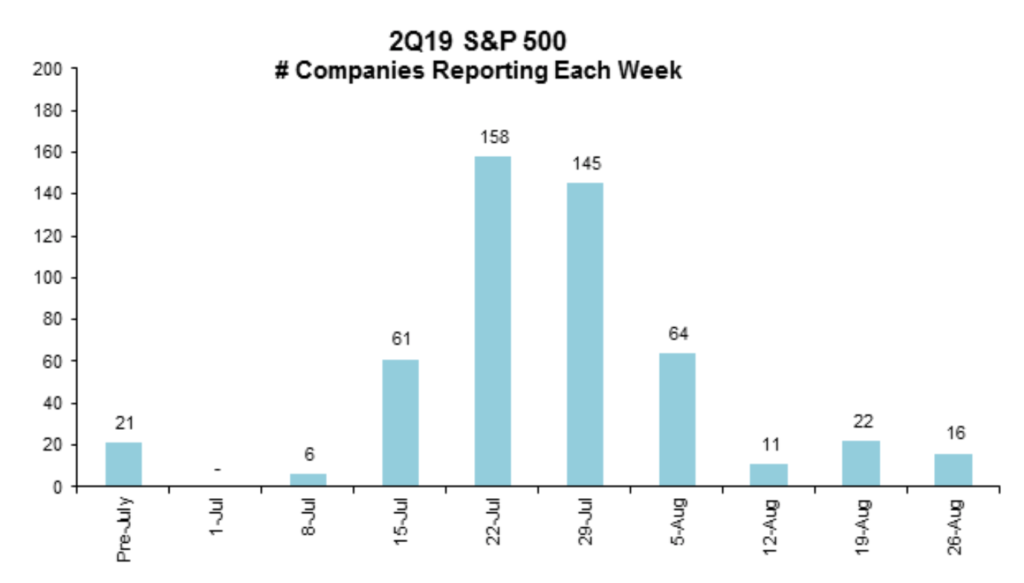
There is a debate as to whether the Fed will cut several times by YE19 as FI markets hope, or just do one ‘insurance’ cut – should the Fed start a new rate cut cycle, this will imply underlying macro conditions are weaker than equities are discounting. Our base case remains that the US economy is resilient, and the Fed will cut once, later this month, then pause but with S&P 500 expensive ahead of what may be two years of earnings contractions. Q2 results loom as the key driver for equities starting off in the week of 15th July, with about 50% of the S&P 500 reporting by week of 22nd July (Figure 1). The bar is a conservative one, given a dismal reading of MS’ Negative-to-positive guidance ratio of 3.48x. There is, obviously, a disconnect between the reason why both equities and FI rallied strongly last month. We see downside risks for both asset classes but, should FI be right and a recession is imminent then equities and HY FI would suffer sharp reversals.
![]()
![]()
![]()
![]()
Figure 1: No. of S&P 500 companies reporting each week Source: Morgan Stanley
On US and China’s trade truce during the G20 Summit, MS notes: “Developments over the weekend do not do enough to remove the uncertainty created by trade tensions, and they remain an overhang on corporate confidence. Risks remain skewed to the downside – if trade tensions escalate, (i.e., the US imposes 25% tariffs on the remaining US$300 billion of imports from China and they remain in effect for 4-6 months), we could wind up in a global recession in about three quarters.”
The recent history is that trade truces do not hold for long and underlying fundamental differences re-emerge. China will not accept US enforcement and monitoring, removal of industrial subsidies and constraints on its Made in China 2025 objective while US wants China to undertake structural changes. We do expect a deal later – by late Q4 or Q1CY20 – given US election realities and for economic factors in both countries but it is quite possible it gets worse again before it gets better.
Equities
- US equities continued to climb the wall of worry this month but saw a late rally after last weekend’s Trump-Xi meeting which bore a largely positive outcome. The three major indices had a similar performance, gaining 7% to see the S&P 500 have its best June since ’55 and the best 1H since ’97.
![]()
![]()
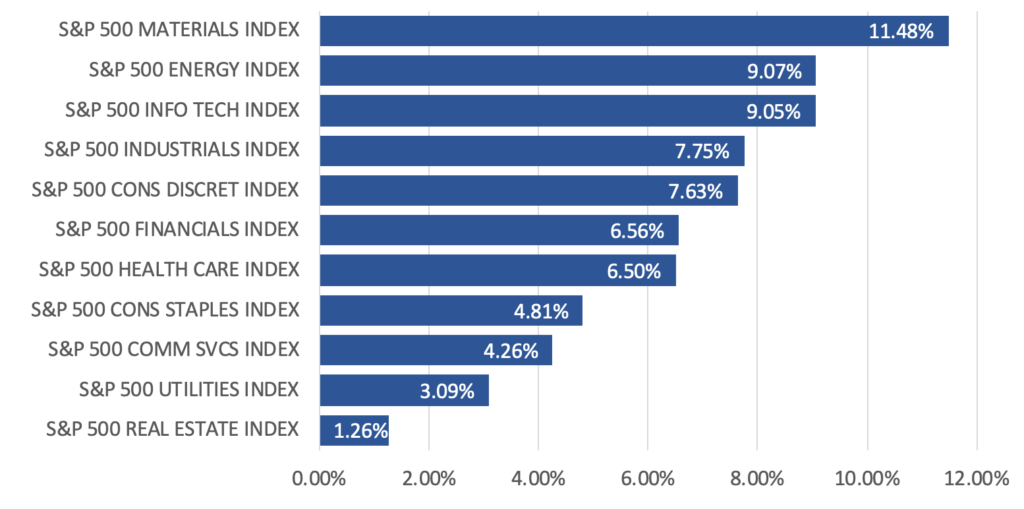
Figure 2: S&P 500 sector performance Source: Bloomberg
- In the S&P 500, Materials (+11.48% MoM) led gains, alongside Energy (+9.07% MoM) and Info Tech (+9.05% MoM) shares which also outperformed. Risk-on sentiment saw a rotation out of defensives like Real Estate (+1.26% MoM), Utilities (+3.09% MoM), Communication Services (+4.26% MoM) and Consumer Staples (+4.81% MoM) (Figure 2). Value stocks also outperformed growth significantly this month (Figure 3).
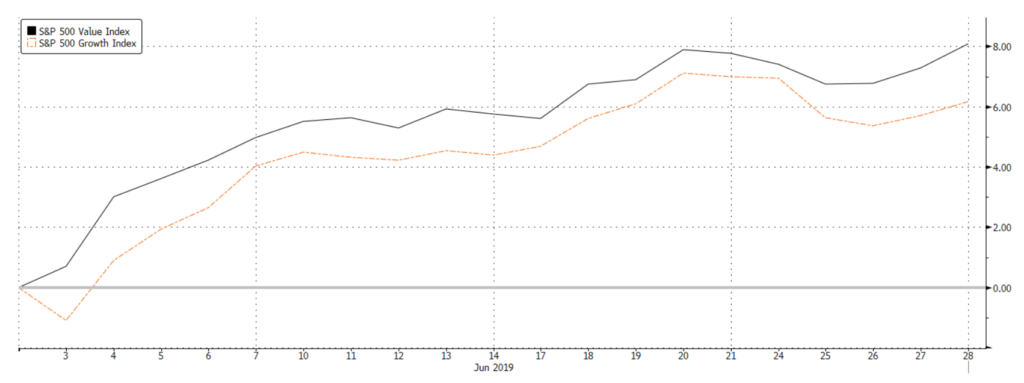
Figure 3: Value vs. Growth Source: Bloomberg
- June did see a string of weak data releases from the US, which was arguably supportive of equity markets as the case for rate cuts grew even stronger. Although June’s Fed meeting saw rates unchanged, this sentiment was echoed by Powell who took on a much more dovish stance, signalling possible rate cuts and indicating that the Fed would ‘act as appropriate to sustain the expansion’, without any mention of the earlier-emphasized ‘patient’ approach.
- To the extent that US equities have rallied to fresh all-time highs, we think that much of the recent good news (trade ‘truce’ back in play, a ‘dovish’ Fed likely to cut rates, decent Q1 results) has already been priced-in. It is hard to see catalysts that would help sustain a rally in US equities from here. In fact, a higher probability of further GDP downgrades will inadvertently exacerbate EPS estimates to the extent that this may impact markets quite significantly. As such, keeping a close eye on Q2 results will be key, and if we see a quarter of earnings contraction alongside GDP downgrades, that will be very negative for US markets.
- The Stoxx 600 (+4.28% MoM) gained likewise, seeing broad-based gains across all sectors with the exception of Real Estate (-3.87% MoM). Basic Resources (+9.46% MoM) and Chemicals (+8.24% MoM) outperformed significantly, while Banks (+1.57% MoM) and defensives lagged (Figure 4).
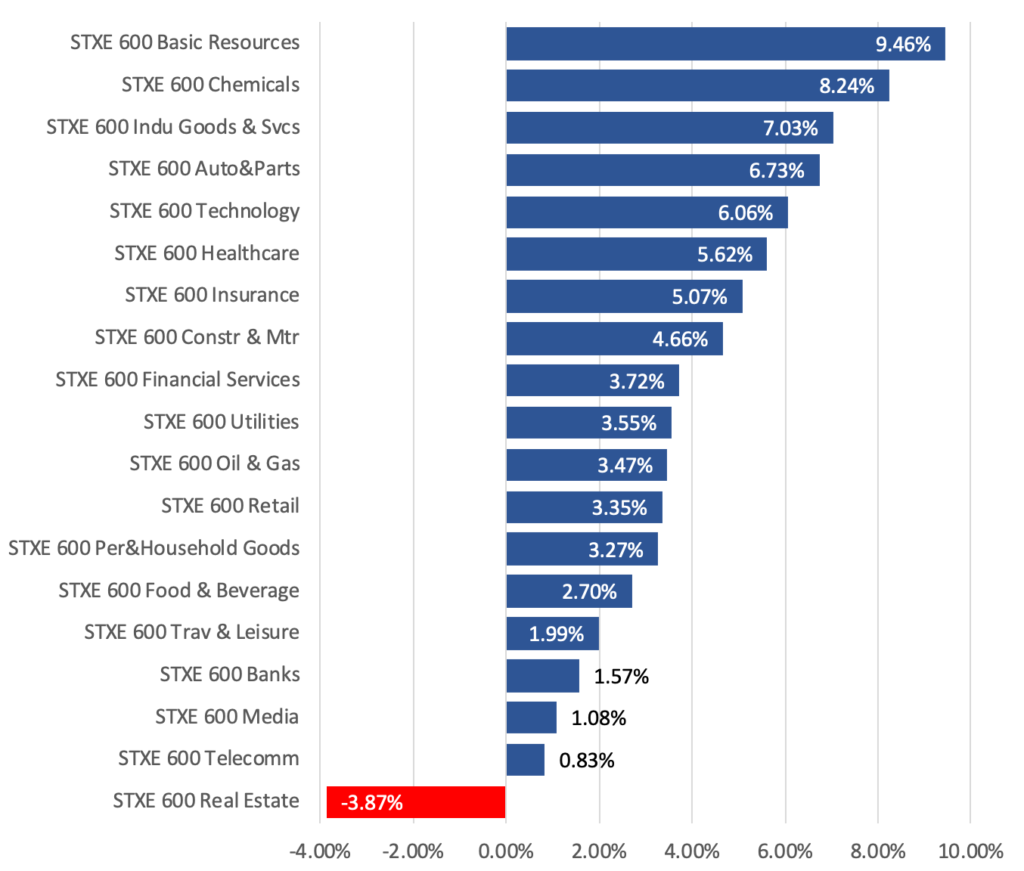
Figure 4: Stoxx 600 Sector Performance Source: Bloomberg
- This quarter, the index managed a slight 1.52% QoQ gain though performance varied significantly. The German DAX (+7.57% QoQ), Swiss Market Index (+4.44% QoQ) and France’s CAC 40 (+3.52% QoQ) lead the broader market, while Spain’s IBEX (-0.45% QoQ) underperformed significantly (Figure 5).
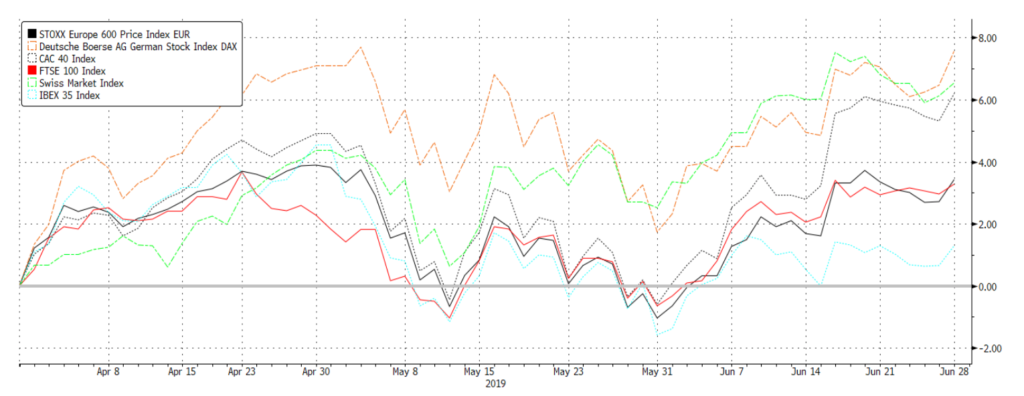
Figure 5: Regional indices performance Source: Bloomberg
- Economic data in this region has been weak so far this year, and has not shown any signs of significant improvement in the near-term. This will like weigh on the economic growth in Europe, which will in turn affect the corporate profit cycle in the region. In addition, the region is facing further headwinds in the form of potential trade tariffs from the US. US’s auto tariff threat still hangs in the background, along with the US Trade Representative’s recent proposal to impose tariffs on $4bn worth of European goods, increasing risks of further growth downgrades as supply chains are disrupted.
- Asian equities were broadly higher this month, not least helped by the positive rhetoric leading up to and the eventual ‘truce’ that between Trump and Xi during their meeting. This quarter, the MSCI ASEAN (+3.93% QoQ) outperformed, alongside the Sensex (+1.87% QoQ) which came off slightly from its all-time highs logged earlier in the month. China A-shares (-3.62% QoQ) also gave up some its gains from the Q1 rally, though recovering significantly from April and May’s steep decline (Figure 6).
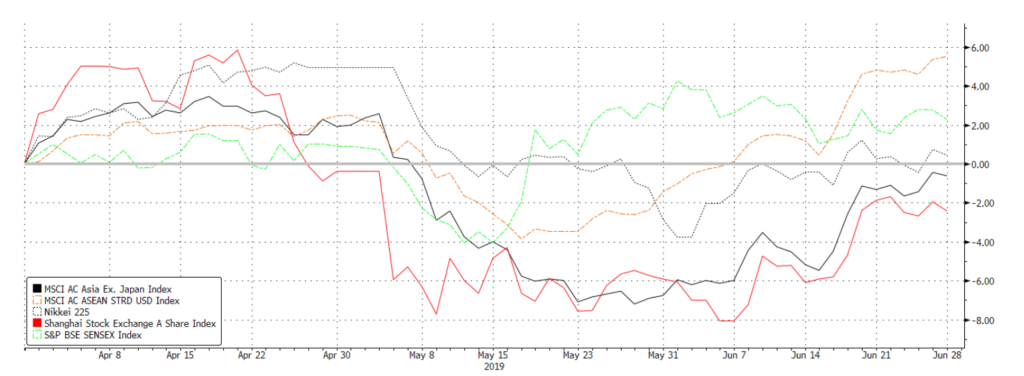
Figure 6: Asian indices performance Source: Bloomberg
- The US-China deal has been undoubtedly positive for Asian equities, fuelling in particular a recovery in Chinese markets over the past week or so. Understandably, this is likely to carry on if trade tensions between the US and China simmer and of course, if the former does not start putting pressure on the rest of APAC to re-negotiate terms. In the longer-term, however, we would caution once more that the substantive, structural issues still remain and there is a reasonable chance that relations between China and the US could deteriorate again, just as it fell apart during the last round of negotiations which many (including us) had thought would have resulted in a far more substantial agreement by this time of the year.
Fixed Income
- Rates were in focus last month as central banks globally expressed dovishness. In addition to dovish statements from the Fed and ECB, BOJ held rates but pledged to continue its bond purchases while widening the purchase range for 1Y to 3Y JGBs to between JPY 250bn and JPY 500bn for July; central banks in Asia mostly held rates constant (except India, which cut its rates by 25bps) but expressed dovishness in response to the Fed’s decision.
- The UST yield curve shifted lower throughout the month on expectations of a July rate cut, coupled with moderately weak economic data. Shorter duration yields, which are typically more sensitive to policy changes, saw greater falls, causing the curve to steepen. the 10Y UST yield broke below a significant support of 2% intraday for the first time since November ’16. The 10Y yield found support at that level and has been fluctuating around the 2% mark for the rest of the month.

Figure 7: Spread compression pushed overall yields lower Source: Bloomberg
- Credits moved higher in June too, with all sectors ending the month higher. Yields across all sectors fell, mostly from spread tightening (Figure 7). Investors were less cautious in June, as HY debt broadly outperformed IG, with the safer BB debt outperforming the riskier CCC bonds. The Bloomberg Barclays US HY index yield fell below 6% for the first time since April ’18 and saw the biggest MoM fall since January.
- However, the best performing sector in June was EM local currency sovereign debt as investors looked for yield in today’s yield-scarce environment. While the index spread tightened only a mere 4.26bps, a weaker USD in June and the dovish sentiment from central banks in the EM regions helped boost returns in this sector.
- We expect the Fed to cut rates by 25bps later this month as a form of an insurance cut, then pause. Markets are pricing in a 100% probability of a cut this month and it is highly unlikely the Fed will not go ahead, barring some extraordinarily positive June macro data. Whilst there are polarizing views over whether this is the start of a new Fed rate-cut cycle, we do not feel the macro data is sufficiently weak to lead the Fed towards that direction despite some warning of imminent recession as early as H2CY19.
- Lagarde’s nomination could potentially be supportive for European sovereign debt, given how she is seen to be more accommodative and will likely continue the monetary stimulus that Draghi has started. This could place more downward pressure on Bund yields.
FX
- A weak month for the dollar and volatility remains low. Key events, such as the lack of negativity during G20, a trickle of negative and inflated data led markets to experience bouts of volatility but with an emphasis on the lack of directionality.
- The Fed’s comments after June’s FOMC meeting led markets to price in a Fed cut in July. This leads us to shift our base case to a data driven dollar with traders and investors wondering if July will be a ‘one and done’ cut. The DXY fell below its 200DMA of 96.715, a major support level since ‘18, since peaking at a resistance level of 98.30 before recovering to 98.80. We see this recovery as a short bout of strength caused by the lack of negativity from the G20 meeting.
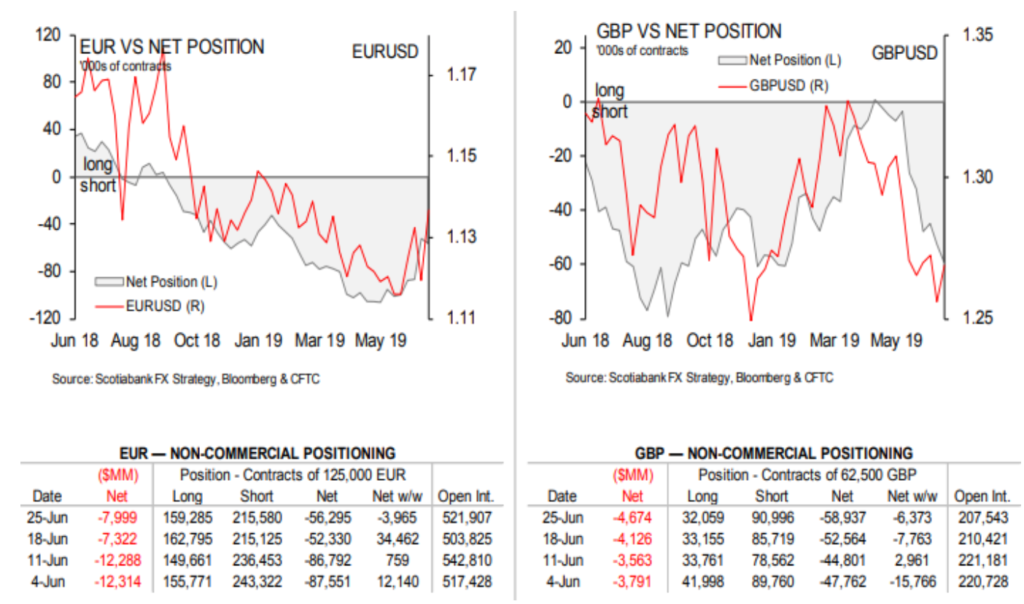
Figure 8: EUR and GBP non-commercial positioning Source: Scotiabank, Bloomberg, CFTC
- CFTC reports showed shorts decreasing rapidly in the EUR (Figure 8). The currency finished stronger in June against the USD, with traders adopting a positive view towards the ECB, relative to the Fed. ECB’s election of Lagarde also came as a healthy surprise to the market.
- Haven currencies also saw a dramatic reversal in shorts, with JPY being net long at the end of June among both retail and institutional traders. JPY gained significantly throughout June. We attribute the bulk of JPY’s strength to dollar weakness and haven attributes. However, the significant data that Japan reported, such as its Tankan survey as well as overall industrial production painted a much more negative outlook for future data. CHF also followed suit, drastically decreasing in shorts.
- Our views for Q3 will be based off yield directionality, CFTC sentiments, as well as economic data. These factors might point to a weaker dollar, but we think the USD will be supported by relative weakness in its major counterparts like EUR and GBP.
- Markets might move JPY higher if there are any potential trade tensions in the near-term, given its status as a haven currency, given that the net longs we have seen in CFTC reports. However, we remain sceptical of the fundamentals behind that shift as a worsening trade war will adversely affect Japan’s economy, notwithstanding the risks of auto tariffs still hanging in the background.
Commodities
- Oil picked up from May’s drop of US$73.60/bbl to US$62.30/bbl, boosted by two significant events: (1) Heightened tension between the US and Iran, and (2) OPEC+’s extension of its 1.2mbpd production cut to March ’20. Till mid-June, Brent ranged from US$65.00/bbl and found support at US$60.80/bbl as the International Energy Agency released its monthly report for June. Key takeaways from the report are (1) Global demand will slow by 0.1mbpd from May’s report; (2) ‘20 estimates non-OPEC production to be up 2.26mbpd; (3) OPEC crude production down 0.23mbpd, due to Iran production. CFTC reports showed WoW positions becoming net positive from the week of 18th June and onwards (Figure 9).
 Figure 9: WTI non-commercial positioning Source: Scotiabank, Bloomberg, CFTC
- We currently see a trading range for oil between US$60.80/bbl – US$68.00/bbl. We base this view on both negative and positive factors cancelling themselves out. OPEC+’s production cuts and Trump’s pressure to drive Iranian production to zero (and potential for tensions to escalate), are stopping oil from breaking below a short-term support of US$60.80/bbl. On the other hand, a slowdown in global demand for oil, as noted by the IEA (due to trade wars) and record production in US shale have been massive headwinds for oil. This stopped oil from advancing past US$67.75/bbl during June.
- Gold surged 9% from US$1306/Oz to a 5-year high of US$1439/Oz before retracing slightly and ending the month US$1409/Oz. The surge reflects perceived dollar weakness from the upcoming Fed cuts in July. On technicals, gold broke above a 5-year long resistance at US$1350/Oz, before continuing higher to US$1439/Oz. It is worth mentioning that as June came to an end, Gold failed to break above US$1439/Oz twice, confirming a resistance level.
- In our view, the outlook for gold will largely depend on dollar directionality. But in the shorter-term, we see buying opportunities should Gold retreat to $1380/Oz, in particular as investors start taking profit on the rally