
Lex Capitis Odyssey Corporate Advisory’s periodical that highlights capital and financial markets developments and its potential implications for you and your business.
Odyssey Corporate Advisory is an independent boutique consultant providing business advisory, investment consultancy, project management and coordination services for companies that intend to access the Hong Kong capital markets.
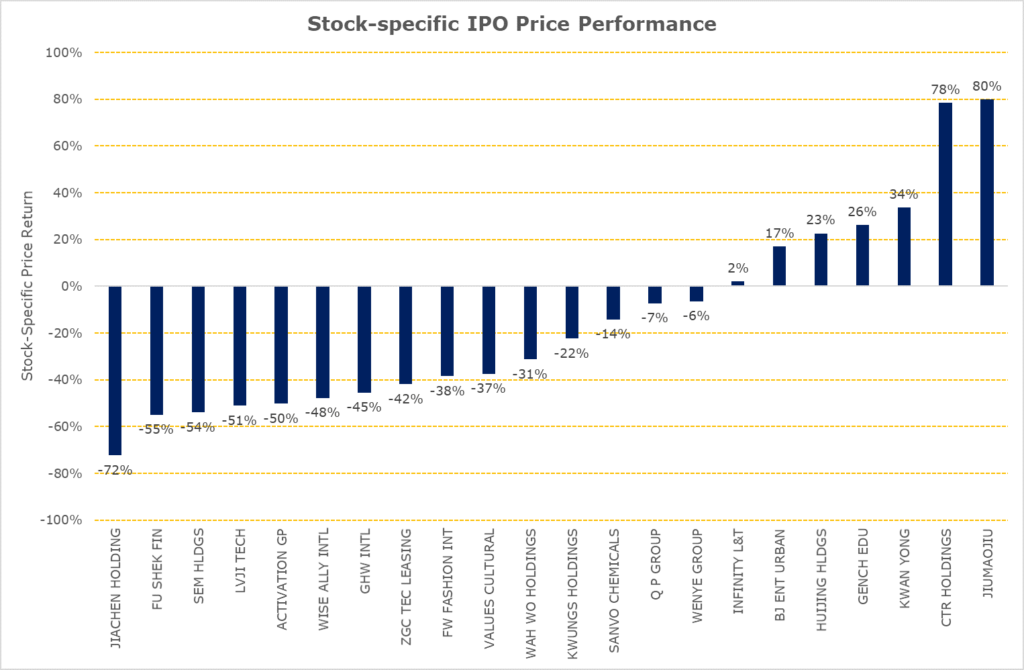
Searching for Diamonds in the Rough
Source: Bloomberg, Odyssey Capital
Summary:
- IPOs of Singapore and Malaysia companies during the two months of 2020 have outperformed the market;
- The price-performance of IPOs with cornerstone investors, on average, performed better than IPOs that did not have cornerstone investors during this period. However, stock-specific factors in each IPO were the key determinant in price performance;
- Size matters, on average, during this period as IPO with a market capitalisation that is greater than HK$1 billion performed, on average, better than IPOs market capitalisation less than HK$500 million. However, stock-specific factors in each IPO drove the disparity in price performance.
IPOs during January and February 2020
During the first two months of 2020, 24 companies listed on the Stock Exchange of Hong Kong. 22 companies were listed on the Main Board and two companies on GEM. There was no one particular industry that dominated, with companies ranging from the construction to television industries. Four IPOs (Wenye Group, Wah Wo Holdings, Jiachen Holdings and China Hongguang Holdings) were undersubscribed in their placing offer and one IPO (HuiJing Holdings) was undersubscribed on the public offer.
| Geography | Board of listing | No. of IPOs | Average returns of IPOs | Average returns of IPOs adjusted by HSSI returns |
| China | Main Board | 17 | -27% | -19% |
| Hong Kong | Main Board | 3 | -38% | -31% |
| Macau | Main Board | 1 | -57% | -54% |
| Singapore | Main Board | 2 | 43% | 56% |
| Malaysia | Main Board | 1 | -6% | 2% |
| China | GEM | 2 | -37% | -30% |
Figure 1: Average IPO returns
Source: Bloomberg
Given the current market environment, we examined the stock-specific returns from their IPO date to 29 April 2020 by adjusting each IPO’s price-performance by the price return of the Hang Seng Composite Small Cap Index (“HSSI”). The HSSI is the appropriate market proxy because the IPO market capitalisation of the companies during this period ranged HK$500 million to HK$10,140 million which is within the scope of HSSI’s constituents market capitalisation. Contrary to an earlier media report about the unattractiveness of South-East Asian companies listing in Hong Kong, investors would, on average, have benefitted from investing Malaysian and Singaporean companies that IPO during this period.
Time to Listing
| Longest application days | 345 |
| Average application days | 198 |
| Shortest application days | 119 |
Figure 2: Timing from application to allotment of Shares
Source: Odyssey Capital
There was no change in the time required for the listing process, the average time from submission of the IPO application until the allotment of shares took more than six months, i.e. it required at least one renewal of the IPO application. The IPO that took the longest was almost a year whilst the shortest took just under four months. There was no discernible difference in the time required between main board applications and GEM board applications.
Size Matters?
| Stock Code | Name | IPO Market Capitalisation (HKD Millions) | IPO returns adjusted by HSSI returns |
| 09968.HK | HUIJING HLDGS | 10,140 | 23% |
| 09922.HK | JIUMAOJIU | 9,131 | 80% |
| 01745.HK | LVJI TECH | 2,990 | -51% |
| 01525.HK | GENCH EDU | 2,511 | 26% |
| 03718.HK | BJ ENT URBAN | 2,484 | 17% |
| 09919.HK | ACTIVATION GP | 1,616 | -50% |
| Average Stock-specific IPO Price Performance (Market Capitalisation greater than HK$1,000 million) | 7% | ||
Figure 3: Large IPOs
Source: Bloomberg
| Stock Code | Name | IPO Market Capitalisation (HKD Millions) | IPO returns adjusted by HSSI returns |
| 02528.HK | FW FASHION INT | 800 | -38% |
| 01802.HK | WENYE GROUP | 630 | -6% |
| 01412.HK | Q P GROUP | 628 | -7% |
| 01442.HK | INFINITY L&T | 620 | 2% |
| 00301.HK | SANVO CHEMICALS | 556 | -14% |
| 01937.HK | JIACHEN HOLDING | 530 | -72% |
| 09998.HK | KWAN YONG | 520 | 34% |
| 01740.HK | VALUES CULTURAL | 519 | -37% |
| 01925.HK | KWUNGS HOLDINGS | 518 | -22% |
| 09933.HK | GHW INTL | 510 | -45% |
| 01601.HK | ZGC TEC LEASING | 507 | -42% |
| 01416.HK | CTR HOLDINGS | 504 | 78% |
| 02263.HK | FU SHEK FIN | 500 | -55% |
| 09929.HK | SEM HLDGS | 500 | -54% |
| 09918.HK | WISE ALLY INTL | 500 | -48% |
| 09938.HK | WAH WO HOLDINGS | 500 | -31% |
| 08500.HK | ICONCULTURE | 250 | -48% |
| 08646.HK | CHINA HONGGUANG | 231 | -13% |
| Average Stock-specific IPO Price Performance (Market Capitalisation less than HK$1,000 million) | -23% | ||
Figure 4: Small IPOs
Source: Bloomberg
Although on average, IPOs with a market capitalisation greater than HK$1,000 million performed better than IPOs with a market capitalisation less than HK$1,000 million, there was a wide disparity in price-performance between IPOs. Compared to LVJI Technology Holdings and Activation Group Holdings, 12 small IPOs had smaller negative returns. CTR Holdings and Kwan Yong Holdings had better returns compared to Huijing Holdings which was the largest IPO for the period.
Odyssey Corporate Advisory is a boutique corporate advisor providing independent and impartial investment and capital markets consulting services catered for your circumstances and preferences. Corporate Advisory is a division of Odyssey Asset Management Ltd, a Type 1, 4 and 9 SFC licensed company and subsidiary of the Odyssey Group. If you have any enquiries, please contact:

Kuan Yu Oh
Managing Director, Co-Head of Corporate Advisory
Mobile: +852 6971-7989
Email: kuanyu.oh@odysseycapital-group.com
Notice
This publication is for informational purposes only and does not address the circumstances of any particular individual or entity. It does not constitute financial advice and should not be used as such. You should seek a duly licensed professional for financial advice. For more information about please see our Disclaimer.