
Market View
Wild Horses
In June, risk markets defied rapidly rising new COVID cases in the US and powered higher. Admittedly, the 1.8% rise in the S&P 500 was primarily driven by a 7% rise in the Information Technology and a 5% rise in Consumer Discretionary sectors. Commodity markets also took an optimistic view, choosing to focus on the loosening of restrictions rather than the continuing rise in new COVID cases that reached over 200,000 per day. This seems to be affirmation of two beliefs; 1) China’s recovery was gaining traction, and 2) the bet that 2nd wave cases would not result in the wholesale global return of mobility restrictions. This led to WTI oil and copper prices to surge 11% and 12% respectively. Equity markets and currencies that had significant commodity exposure rose accordingly. The once popular economic indicator, the Baltic Dry Index, shot up 260%, mainly on the back of increased iron ore shipments to China.

Source: Bloomberg
Indeed, China’s improved industrial production, industrial profits and retail sales numbers for May provided a sense of economic stability. When the positive PMI figures were released at the end of June, indicating an improving trend, China’s equity markets initiated one of its infamous “ears pinned back” rallies. Just one week into July, the CSI 300 has jumped 14% and the MSCI China Index has scrambled to keep up with a 9% surge. While the economic data provided a supportive backdrop, it has been the media drive by the government for people to invest in the equity market that is likely to have had a material impact to the speed of the rise. This is reminiscent of the 2015 boom bust where the CSI 300 doubled in just two months but then gave back 80% of the climb in the subsequent two months. The whole up and down move was largely due to government encouragement and then cessation of the media campaign. Hopefully, experience will temper the market enthusiasm this time.
Tail of 4 Markets
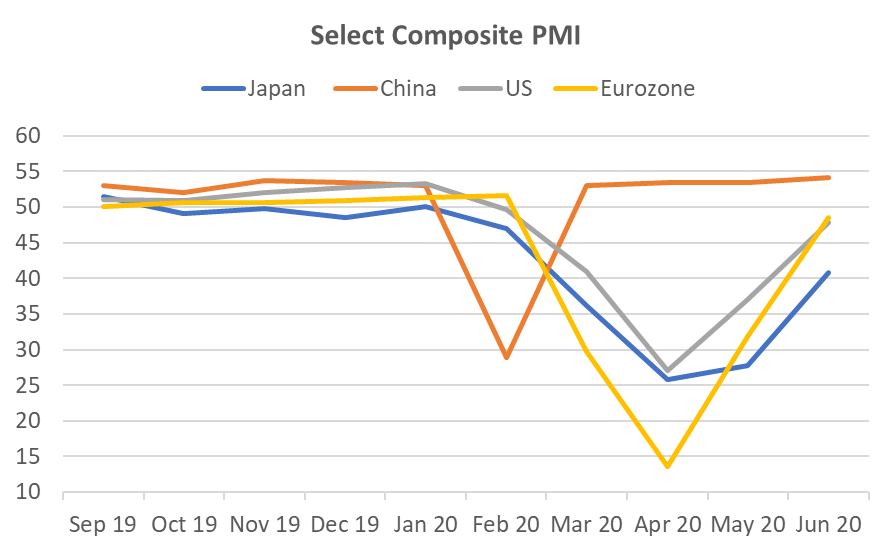
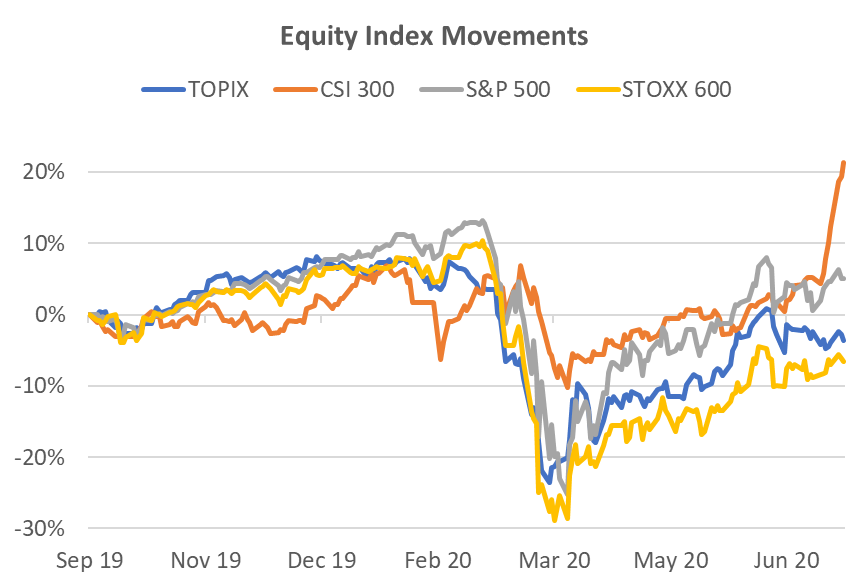
The reliability of China’s economic data has been in question since the 1990’s. If we assume it’s a reasonable representation, based on simple PMI comparisons it could be argued that China’s equity market performance should, indeed, be ahead of other major markets. China only suffered one dramatic month’s dip in PMI before heading back to growth again. Other major regions have suffered 3-4 months of below 50 readings. China’s equity market did not fall dramatically until markets in other regions began to plummet. This occurred when you could argue China’s economy was already stabilising.
 Source: Bloomberg
 Source: Bloomberg
The other point worth noting is that both the best performing indices, CSI 300 and S&P 500, have less exposure to offshore revenue than either the Topix or the Stoxx 600 that have more than 60% of revenue from offshore. The means any stimulus is likely to be more efficient for the companies in the China and US indices.
Laggards Still Lagging
The market likes what it likes. Currently that does not include banks and industrial stocks, globally. These sectors tend to be more exposed to lockdown restrictions that have been slower than expected to unwind. In a related statistic, in June, US Growth stocks rose 4.1% while Value stocks fell 1% to continue a well-worn path for the last 10 years with the rise and rise of tech stocks. The eventual recovery of the laggards probably heralds the final phase of the equity market dislocation.
This laggard theme also extends in a smaller scale to the credit markets where Asia corporate bonds remain 230bp wide of US corporate bonds. However, Asian bond credit spreads are steadily grinding tighter against their US counterparts, making it an easier choice than exposures to nominally cheap but unloved stocks.
 Source: Bloomberg
If you like to receive more information on our portfolios solutions, please contact us here: info@odysseycapital-group.com