
Market Update: April 2021
For Accredited Investors Only as defined in the Monetary Authority of Singapore Securities and Futures Act (Cap. 289) and its subsidiary legislation. For Professional Investors Only as defined in the Securities and Futures Ordinance (Cap 571, Laws of Hong Kong) and its subsidiary legislation. This advertisement has not been reviewed by the Monetary Authority of Singapore.
April 2021 Insight
All Roads Lead to New York
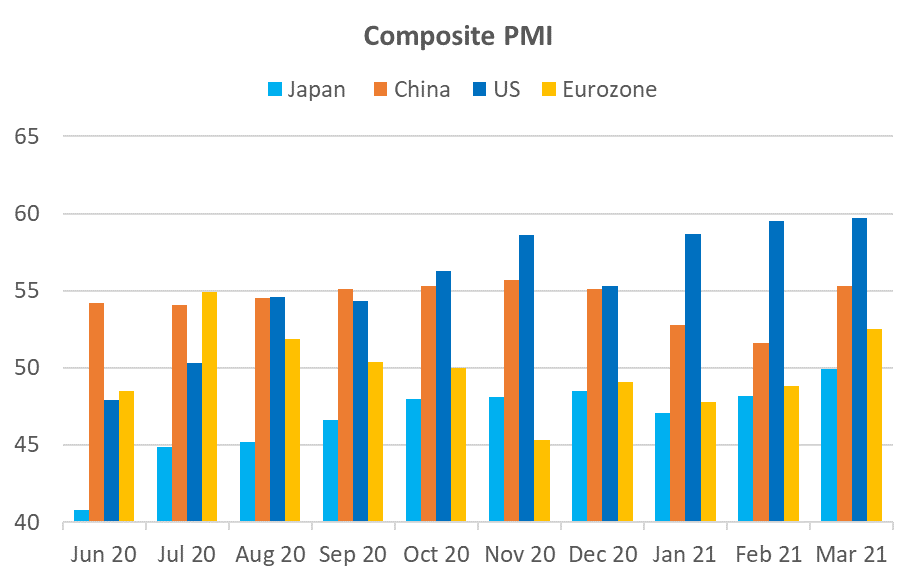
The first quarter produced solid returns for risk investors overall but proved to be tricky for tech stock investors, small-cap speculators, and long-duration bondholders. A major reason was the rise in long-end yields which questioned the valuation of growth stocks under the glare of potential inflation. The flip side of this argument is that the caution around inflation has been inspired by the rapid recovery in economic growth, particularly in the US. Unlike other regions where the economy faltered in January and February, US PMI has been consistently strong in Q1, underscored by Non-farm payrolls surging to 916,000 in March, 250,000 ahead of consensus. Gains were led by leisure, hospitality, and construction – sectors that had been hit the hardest during COVID.
A potential game-changer is President Biden following up a USD1.9tn relief bill with a massive USD2tn plan to reinvigorate US infrastructure. No doubt the plan will go through several iterations before approval, but despite Republican aversion to taxes, conceptually it should gain bipartisan support. Even spread out over 8 years, this would be a long-term fillip for the economy. As Jamie Dimon wrote in his 2021 letter to JPMorgan shareholders “the economy will likely boom”. Given the strength in the US economy, the potential for further stimulus, and the superior speed of the vaccine rollout (as of April 7, 64mn Americans had been vaccinated), it remains our most favoured investment destination.
Source: Bloomberg
Possible Speed Humps
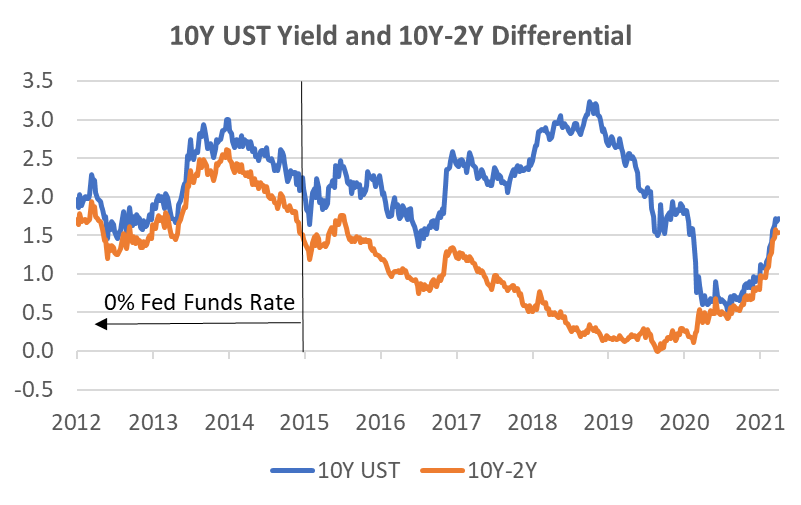
There are two short-term caveats to our optimistic view on the US. The first is that the long end of the rate curve is likely to continue to rise as the economy strengthens. While the momentum appears to have subsided for now, the absolute level of the UST10Y, as well as the UST10Y-2Y yield differential, remains well below levels in the last decade during “normal” economic conditions, even when the target rate was anchored to zero. Any rapid rise in long-end rates would likely again represent a headwind for growth stocks.
Source: Bloomberg, Odyssey
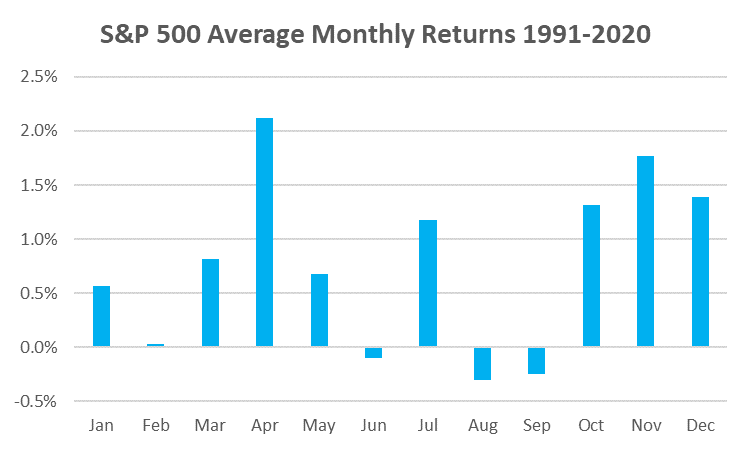
The second potential short-term headwind is one we face every year. The statistical “Sell in May …” is real, although with statistics we are talking about an average number. In the last 30 years, the May-Sep period returned +1.3% on average and was positive 70% of the time. In comparison, the Oct-Apr period returned +8.4% and was positive 83% of the time. There were actually 5 months with worse average returns than May which returned +0.7%. April, November, and December were the best-performing months. The other noteworthy feature is that the standard deviation for monthly averages was uniformly high at circa 4%. Since the level of dispersion is twice the highest average monthly return, making generalisations can be quite risky.
While these types of statistics should not be relied upon, it does show that, as long as the fundamentals are positive, the May-Sep period can be a profitable one. It’s just that the risk-reward is generally not as good as during the Oct-Apr period.
Source: Bloomberg, Odyssey
Some Respite for Income Investors?
After a strong 2020 when investment grade (IG) credits benefitted from both falling rate yields as well as recovery in spreads from April onwards, 2021 has been a different story. The Bloomberg Barclays Global Credit Index has returned -3.5% YTD. With a lower duration and a 2.75% higher yield, the Global HY Index has fared better with a 1.1% return. The main driver of credit returns this year has been long-end rates. With credit spreads remaining close to all-time tight levels, future returns are likely to continue to be at the mercy of long-end rate movements.
One liquid yield play that has performed well despite rate movements has been REITs. While REIT prices have traditionally shown a negative correlation to the direction of yield movements, recent upward grinding moves of the sector have been due to the recovery in the price to book ratio (PBR) that fell 37% in Feb-Mar 2020. Now that the PBR has recovered close to its 5Y peak at 2.4x, but the estimated dividend yield has fallen to just 3.1% compared to its usual 3.5-4.5% range, the upside may now be more limited. We say “may” because the market cap of many recovery stocks is now higher than where they were pre-COVID, even adjusting for a “normal” operating environment.
Investment Recommendations
Laggard Recovery Plays
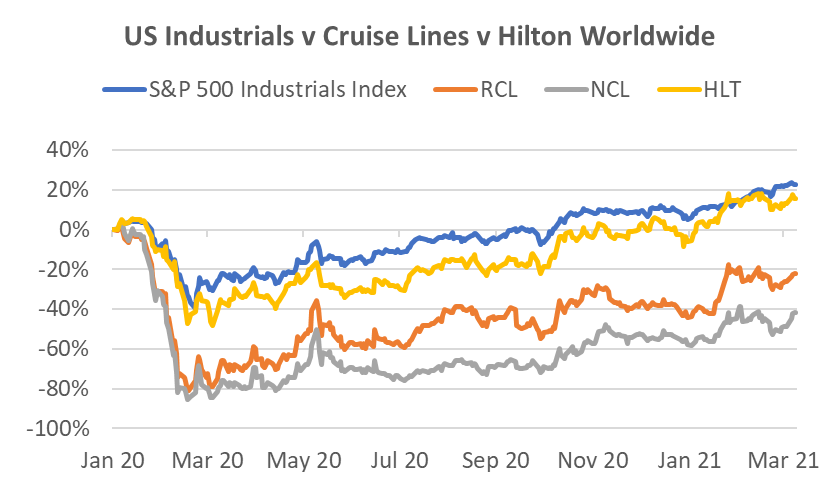
The Industrials sector is an obvious recovery play. While the Industrials sector is full of cyclical stocks, in many cases the market has already valued a full recovery despite current difficult trading conditions. Indeed, the US Industrials Index is now 18% higher than the pre-COVID peak and performance only lags the S&P 500 Index by 3%.
One industrial sector that has lagged, but has recently received highly positive news, are cruise lines. On April 7 the US CDC has stated US cruises could resume by mid-summer. Norwegian Cruise Lines (NCL) has already stated it plans to start cruises from US ports on July 4 with fully vaccinated guests. Bookings for H2 2021 have been accelerating in recent weeks and prices have been more resilient than expected. While H2 2021 bookings are still shy of 2019, 2022 bookings are well ahead of 2019 due to very strong pent-up demand. With better guidance in respect to re-openings, the share prices of listed hotel chains such as Hilton and Marriott are already back to, or above, the pre-COVID peaks whereas NCL and Royal Caribbean Lines (RCL) remain circa 40% and 20% respectively below their peaks. For NCL, we like their smaller, more modern fleet that appears at an advantage in the post-COVID environment, and RCL is the premium brand in the sector, a factor we rarely ignore in an early upswing cycle. These stocks can be more volatile than the mega-cap we usually recommend and should be sized accordingly.
Source: Bloomberg, Odyssey
Social Media is All About the Camera
We’ve been encouraged by our recent positive calls on Facebook and Google. Another we have liked since their blockbuster Q4 result is Snap Inc (SNAP). The stock then fell 30% due to rising rates but has since begun to climb back up. It’s not a cheap stock on traditional measures but management’s recent rare claim that they believe revenues can potentially grow by 50% for several years means short-term valuations do not capture the embedded value in the business. For instance, Snap’s ARPU is currently less than 10% of Facebook’s. That’s a lot of upside for a company that is widely acknowledged as one of the most innovative among social media platforms, thereby maintaining its “lit” status among the young. Many of Facebook’s features appear after Snap first introduces it on their platform and this is likely to continue. Indeed, Snap is now designing products it says are more difficult to replicate and many of these revolve around the phone camera. In addition, they are doubling down on what they believe is the next evolution in computing, augmented reality (AR). Revenue growth of 62% in Q4 2020 demonstrates its leverage to the recovery in ad spending, but it also underscores the structural growth story of harnessing social media among a younger audience.
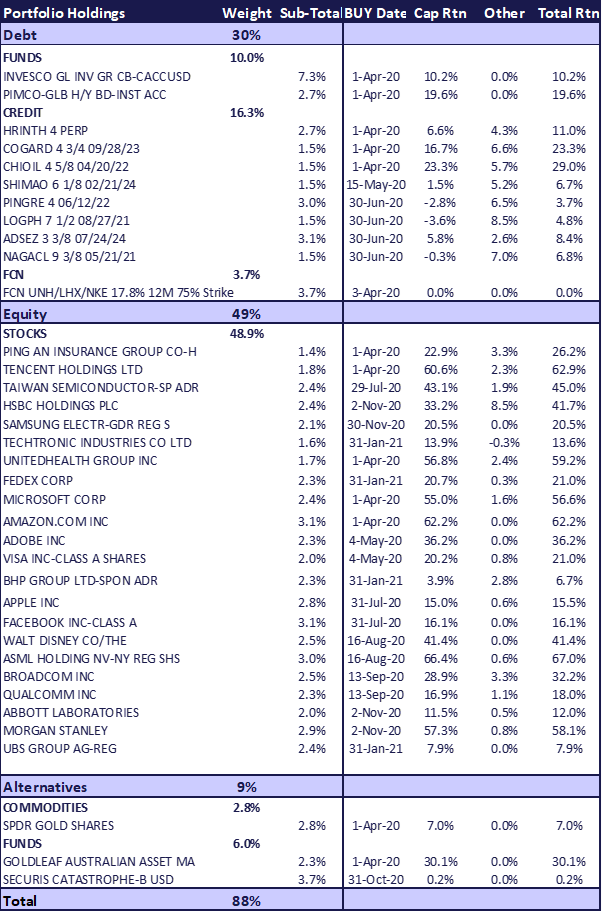
Odyssey Model Portfolio Performance

Horizon Performance

If you like to receive more information on our portfolio solutions, please contact us here: info@odyssey-grp.com.


