
“Ultimately lower rates are only good to a point because, eventually, the fall in rates is not just about the Fed giving equity investors a “green light” to load up on risk, but also indicates concerns around GDP growth.” `– MORGAN STANLEY
Look through or come off. Financial markets have been surprisingly resilient since the lows at Christmas Eve. Optimism over an early US-China trade deal, the obvious pivot by the Fed to be more ‘dovish’ (FI markets expect a rate cut in ’19 now) relative to its ‘hawkish’ stance last October, and other central banks’ like the ECB and PBoC and China’s more aggressive fiscal reflation, have all helped improve investor sentiment with markets rallying from very oversold conditions at YE18.
Whilst there are undeniably positive drivers, our cautious tactical stance remains as we believe the US-China trade deal will disappoint in leaving considerable post-deal uncertainties with a still material risk that a deal will fail given the wide differences between both parties over post enforcement checks. Underlying corporate earnings are still being downgraded and Q1 results may well disappoint at a time where the S&P 500 has become expensive relative to history whilst other markets are no longer cheap. GDP forecasts continue to be lowered – notably in EU – although China’s GDP outlook has ‘firmed up’.
Political risks are rising in Q2 – notably Brexit agonies, where a ‘no-deal’ is still a distinct possibility, and India, where a likely weak BJP coalition is perhaps the most likely result. Concerns remain around political risks in Turkey, Argentina, South Africa, Brazil, Venezuela, Ukraine and Thailand that could knock-on to EM FX, FI and equities. With strong rallies in equities and JY FI YTD, we believe taking some money off the table makes sense given the potential headwinds and the history of returns in most years since ’09 bar ’17’s exceptional gains. Ultimately, the rally in sovereign bonds YTD, with now around $10tn with negative yields, cannot be reconciled with the rally in riskier assets as the latter implies deflation if not a recession sooner or later.
The main risk to our cautious stance is if investors can use China’s reflation, trade optimism and central banks’ pivot to ‘bridge’ across a weak H1CY19 to an expected recovery in earnings forecast by Q4FY19 and stability in GDP forecasts that would support a further rally in risk assets (and a likely sell-off in USTs). This is not our base case, but we have put in place upside risk management triggers should we be proven wrong.
Recession or not? The inversion of the 3m/10y US yields on 22nd March, the first since ’07, may signal a recession during 2H20 based ib the past albeit this is better in telling us it will happen rather then when (it could be any time from under 12M to well over 3Y). The signal has historically been a reliable predictor of seven of the last nine recessions. There are some very plausible arguments, not least by Mr Dudley (the last New York Fed governor), that this time is different as: quantitative easing by the Fed and other central banks have lowered absolute interest levels to make it technically possible for such an inversion; the Fed is not tightening and financial conditions have eased considerably; there is a breakdown between real interest rates and underlying GDP growth since ’14 as noted by Pictet and; lastly the absence of any obvious ‘bubbles’ in financial assets or the wider economy.
In looking at the components of the US GDP, it is unlikely, given robust consumption underpinned by record low unemployment and accelerating wages (+3.5% YoY in February NFP), we will get a recession in 2020. However, the US economy will slow from Q4CY19 as Federal final spending is set to fall sharply and private sector capital expenditure is expected to ease down, making a ‘shallow’ recession quite feasible. A recession would justify the Fed’s ‘pivot’ and strengthen the FI markets view that the Fed’s next move is to cut rates.
There is a high degree of uncertainty as to what the macro data will bring from deflation and recession to inflation reigniting and GDP numbers surprising to the upside which have binary implications for portfolio construction. Our base case is we avoid a recession this year and next and that exposure to equities remains a better choice than to sovereign bonds. We will need to be nimble and tactically quick to respond to developments which includes a sizable precautionary cash holding to mitigate volatility spikes and to take advantage of them. Strategically we remain convinced we are in a 3.5-year period of low returns and that volatility will rise that argues for portfolio diversification and the use of non-traditional asset classes, as did endowment funds in recent years (Fig 1).

Fig 1: Endowment funds – asset allocation in 2007 vs 2018 Source: Bloomberg, Julius Baer
Equities
-
Despite a rough start earlier in the month, US equities were broadly higher as all three major indices managed a higher close in March. NASDAQ (+2.61% MoM) outperformed as Tech shares rallied, while the Dow Jones Industrial Average (+0.05% MoM) under performed after its biggest index component, Boeing, fell by as much as -17.2% from all-time highs after questions were raised over safety issues relating to the company’s 737 MAX planes. Notably, small caps also under performed, with the Russell 2,000 (-2.27% MoM) logging a decline as concerns over economic growth lingered (Fig 2).
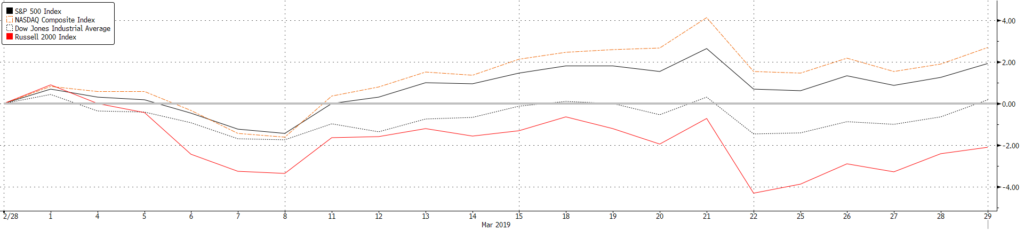
Fig 2: March total returns of the S&P 500, DJIA, Nasdaq and Russell 2000 Source: Bloomberg
-
Technicals show the S&P 500 moved through key resistance levels to within 2% of its all-time high. We believe US equities will struggle to move higher as valuations are now expensive relative to history, and earnings are likely to contract in H1FY19 and we are trimming here.
-
Mueller’s report removes the threat of impeachment ahead of the 2020 elections and helps Trump’s re-election chances, especially if the Democrats were to choose a Socialist candidate.
-
We expect macro data to slow in 2019 as fiscal spending slows sharply in H2CY19 while private capital expenditure weakens, creating headwinds to consumption. Weaker growth would support a higher weighting in ‘growth’ sectors as IT over ‘value’. Hence, we expect Nasdaq to outperform.
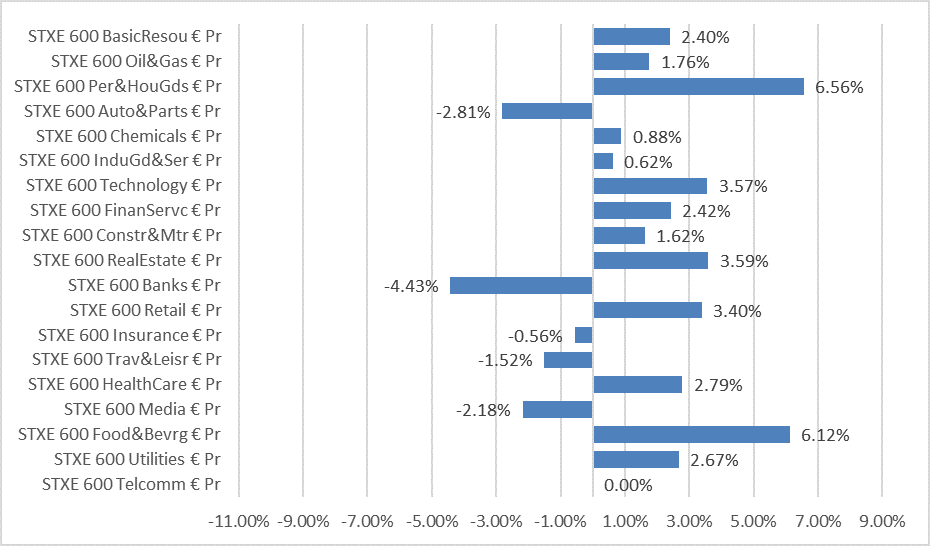
Fig 3: Stoxx 600 MoM sector performance Source: Bloomberg
-
European equities were also higher as Stoxx 600 gained 1.69% in March, led by gains in Personal & Household Goods and Food & Beverages. Bank stocks were the worst performers, after Draghi indicated rates would stay on hold for the rest of the year, a move which sent Bund yields into negative territory for the second time in history (the first being in 2016).
-
Brexit remains the overhang for Stoxx 600 and FTSE 100 and sadly, there is no agreed route and it is still a possibility of a no-deal. The next deadline is 12th April and the hope is an agreement by Parliament based on a ‘softer’ Brexit now that May is reaching out to the Labour party leader.
-
Deteriorating macro data YTD in EU could see the bloc’s economy fall into a shallower, technical recession in 2019 and may imply earnings in 2019 could contract relative to the current consensus of +4%.
-
There are political risks outside of Brexit as well. The EU election during late May might see anti-Euro populist parties gain considerable ground (even more so if the UK was to be involved in the vote) that would likely be a source of volatility in EURO and FI, which will eventually lead into Stoxx 600.
-
Shares in Asia also trended higher across the board, with China A-shares (+5.10% MoM) once again outperforming the region. This time, however, India’s Sensex (+7.82% MoM) surged ahead as INR also gained, taking the index to a +10.17% monthly gain on a USD-adjusted basis. For the quarter, A-shares are still significantly higher at +27.03% compared to the Sensex at +7.79% which still under performs the broader MSCI Asia ex-Japan Index which is up 11.21% in USD terms.
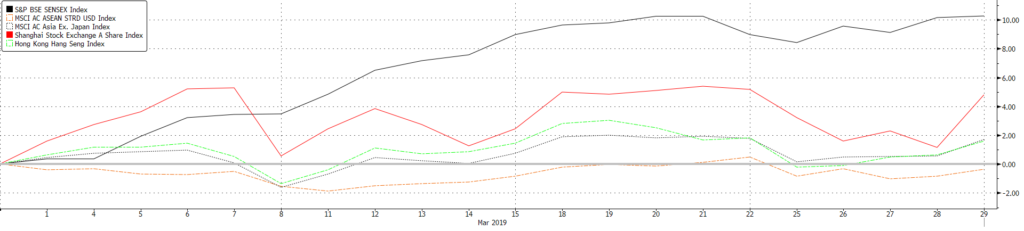
Fig 4: USD-adjusted Total Returns across indices in Asia Source: Bloomberg
-
-
Nikkei, on the other hand, fell 0.84% with the Yen mostly unchanged from the start of the month. Japanese equities continue to under perform in Asia, climbing +5.95% this quarter against most other indices which have logged double digit gains. Last weekend, Abe’s coalition also won approval to run a record ¥101.46tn fiscal budget in 2019, with close to ¥2tn set aside for stimulus measure aimed at cushioning the Oct 1 increase in consumption tax
-
AxJ equities are being led higher by Chinese equities and especially A-shares as local retail investors are buying again along with foreign investors, ahead of an increased weighting in MSCI EM next month. We remain overweight Chinese equities and would use any weakness to add to A-shares as we see it hitting 3,600 during 2019 as reflation of the Chinese economy comes about.
-
Fixed Income
-
The UST yield curve shifted lower over the month, especially in the belly of the curve with the 2Y and 10Y yields inclusive. This caused the 3m/10y spread to invert and led to the steepening of the 5y/30y spread. The Fed’s decision to hold rates in its March FOMC meeting while signalling that it won’t raise rates in ’19 caused the 10Y yield to break its 2.6% support to trade below 2.4% for the first time since December ’17. The 2Y yield also fell below the Fed funds floor of 2.25% after the meeting. However, trade optimism and strong manufacturing PMI data from US and China at the end of the month helped push yields higher. March’s developments saw USTs register their best Q1 result in 3Y as the 10Y yield fell 28bps.
-
European sovereign bond yields fell too as demand increased amid a slowdown in the European economy. The Bunds yield fell and traded below 0% for the first time since ’16. This saw the total sum of negative yielding debt represented in the Bloomberg Barclays Global Aggregate Bond Index to rise to $10.07tn – the highest level since September ’17.
-
Corporate credits saw positive returns across most sectors (Fig 6), but under performed sovereigns as the market turned more risk averse and went up the quality curve. US IG was the best performing sector in the credit space after Asian dollar bonds, returning 2.50% last month. This was mostly supported by falling rates while spreads ended the month mostly unchanged. Strong demand for primary issuances in the IG space also helped lower the borrowing costs for highly rated companies. March saw a 28.57% increase in primary issuances as companies issued $131.28bn worth of debt. IG funds also saw the largest fund inflows in March relative to other sectors. IG funds attracted $13.17bn worth of funds in the month.

Fig 5: Fixed Income sector returns in March ’19 and 19Q1 Source: Bloomberg
-
The key question is whether the Fed’s ‘pivot’, not least in what markets perceived as a ‘dovish’ March FOMC meeting, will prove to be the inflection point in this hiking cycle or, as we believe, a pause. Our view is that the markets have mistaken Powell’s comments to be purely about pausing when, in fact, he explicitly noted that the Fed was data-dependent. We see US macro data as being sufficiently strong to allow the Fed to hike one more time – probably in December 2019, whereas we do see EU data weakness being supportive of the ECB’s recent caution and for lower yields.
-
Whilst we have long failed to find value in higher quality FI (sovereign and IG), even our preferred weightings in US HY FI and Asian HY FI have seen sufficient spread compression YTD to no longer offer much price upside although we would remain invested to ‘clip’ still decent coupons but warn we could see short-term volatility.
-
Tactically, we remain overweight in short-duration paper – be it high quality or HY – as the yield is similar to longer duration paper without the same level of interest rate or default risks.
FX
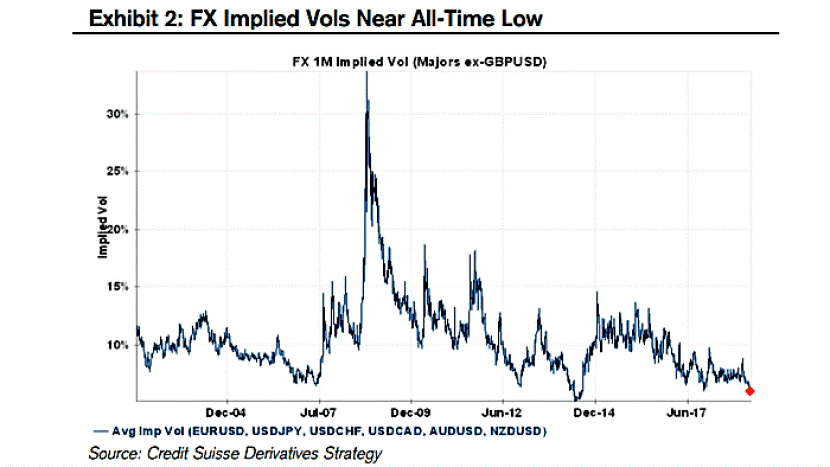
Fig 6: FX implied volatility near all-time low Source: Credit Suisse Derivatives Strategy
-
Volatility in the G7 pairs, bar GBP, has dipped since the start of 2019 as FX markets remain in uncertainty due to key events such as Sino-US trade development and Brexit (Fig 6). EMFX volatility picked up in March, mainly due to BRL, TRY and ZAR experiencing large movements. (Fig 7).

Fig 7: EM FX volatility vs. G7 FX volalitlity Source: Bloomberg
-
The Fed’s dot plot implies that interest rates will remain on hold for the remainder of this year and only improve by +25bps in 2020 and inflation unexpected eased in February. This clarity for the USD has finally come through as markets are no longer pulled by “certainty” (positive market data in Jan/Feb) and “uncertainty” (a “patient” Fed in Jan/Feb). Powell noted that interest rates will remain on hold for “some time”.
-
The Turkish Lira experienced another bout of volatility since Aug 2018. The jump happened overnight and TRY fell 7.50% to 5.84, past a significant key support at 5.50. The Turkish government has reported its suspicion of large foreign banks shorting the Lira. Overnight rates increased to 1300% to prevent shorting. Emergency interest rate measurements taken by the Turkish government failed to suppress TRY weakness.
-
DXY is edging up again towards a key resistance at 97.50 and USD yields bottomed out and it remains, on a relative basis, the best DM economy and that is constructive for the USD. We remain, thus, USD bulls until it is clearer its structural risks (rising fiscal deficit and potential overvaluation) become obstacles.
-
The outlook for GBP, BRL, TRY ZAR and the Argentine peso depends on political developments. An agreed cross-party ‘soft’ Brexit deal would boost GBP towards 1.40 but a no-deal departure on 12th April could sink it back to 1.20. EUR, to a greater extent, will be linked to GBP, but the EU-wide elections could also be a downside risk as it was in ’14.
Commodities
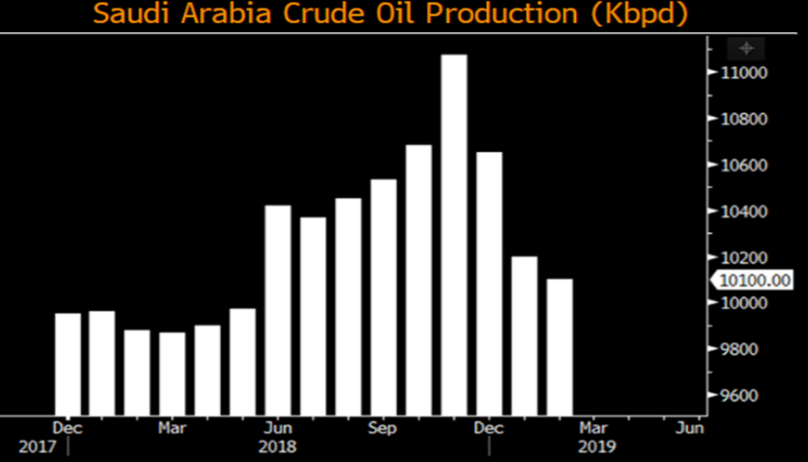
Fig 8: Saudi leads OPEC+ cuts to production Source: Bloomberg
-
Brent crude saw a strong quarter, rising 27.12% YTD and 3.57% in March as OPEC+ cuts to oil production continued. The cartel cut a further 295K/bpd in March, and is believed to continue its commitments to cutting supply and re-balancing the market.
-
Volatile production from countries like Egypt added to supply this month, but we believe that the remainder of OPEC+ countries will eventually catch up and limit their supplies, and this effect should outweigh any of the headwinds.
-
Gold closed mostly flat this month, unable to move past its US$1,352/Oz high in February. This was understandable given the increased risk-on sentiment reflected by the climb in equity markets. This movement in March formed the right shoulder of a Head and Shoulders pattern which started in January.
-
The oil price is being pulled around by OPEC’s (notably Saudi Arabia) supply discipline and regulatory developments on bunker oil relative to rapidly increasing US shale oil production and a slowing global economy impacting demand. In the shorter term, we see the Brent oil price capped around $70/brl but the longer term could see oil prices test $90/brl by 2021 as the effects of the huge 50% fall in capital expenditure since H2CY14 impacts production. Given this, we are trimming our energy exposure.
-
Industrial metals are benefiting from optimism around China’s ability to reflate the economy and from a series of supply disruption that have boosted copper and iron ore at a time the mining giants have proven to be disciplined in capacity expansion, and that could lead to prices moving higher from here in 2019.
CONTACT
We would be more than happy to have an informal chat about these and the other services we offer as well as the current opportunities we are looking at.