Risk assets rebounded strongly in January after a horrific December (Fig 1). The MSCI ACWI gained 7.80% in January, its largest gain since October 2011. This came after December’s fall of -7.17%, the second-largest fall since May 2012. A more significant comparison can be seen in the US, with the S&P 500 seeing its best January since 1987 after its worst December since 1931. Similarly, global investment grade (IG) fixed-income (FI) gained 1.52% in January while global high yield (HY) FI gained 4.39% following December’s 2.52% and -0.75% respectively. The VIX index has also been registering higher ‘lows’ in January, adding to signs that volatility is indeed returning.
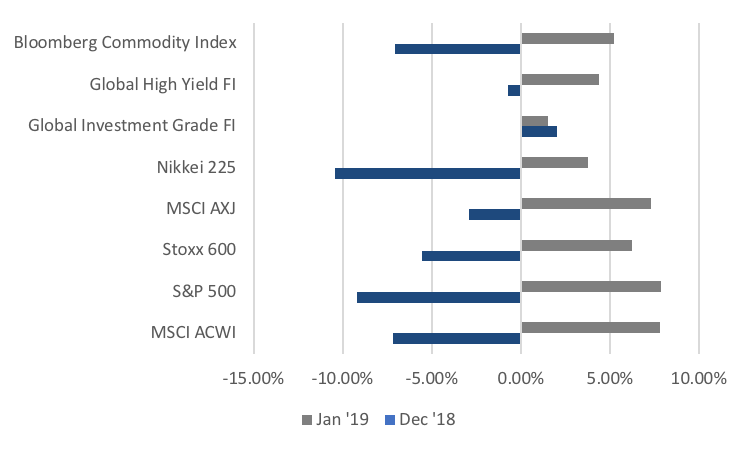 Fig 1: Risk asset performance in Dec ‘18 vs Jan ‘19 Source: Bloomberg
Risk assets were supported on two fronts in January, with the first being optimism around the US-China trade situation. The first major round of trade talks since the Trump-Xi truce took place at the start of the month and ended on an optimistic note. Our base case remains that a narrow trade deal will likely be done, though the US is after a wider deal that addresses structural issues. A dovish Fed also provided support to risk assets, alongside a weaker dollar for the most part of January. Within FX, Asia ex-Japan (AXJ) pairs were the main beneficiaries of the USD weakness as they rebounded from their 2018 lows. There was also volatility around the GBP as it followed Brexit headlines.
Tactically, we remain cautious as fundamentals continue to deteriorate, bar a robust US economy (January’s ISMs and NFP numbers imply Q1 GDP growth of c. 3%), as we continue to see global GDP numbers being downgraded to c. 4-5% growth, from +10% at end of Q3FY18. Historically, equities struggle in the face of deterioration in EPS and GDP forecasts so the billion-dollar question is – what are markets discounting? If the December fall was overdone and predicated on a recession and EPS contraction, then one wonders at what point will this rally run out of steam (barring a US-China trade deal later this month), given that investors have repositioned quite aggressively since Christmas Eve, which has reduced this underpin.
Other than trade, the only other clear positive is that almost no one is positive, with a majority remaining uncertain and fearful. It continues the tradition of this being one of the most hated bull markets and economic expansions of all time, just as these are one of the two longest such periods. Equity bull markets and economic expansions do not die of old age and it is hard to see signs of the euphoria typical of the final stages of a bull market.
Another factor we strongly think is being ignored by markets, is the continued evidence of a strong pick-up in fiscal spending that appears to be globally synchronised. No doubt this is helped by the fact that we are in election years in parts of AXJ, coming into European Union (EU) elections in May, and are at the start of the US election year campaigning. We expect the Federal fiscal boost to continue well into 3Q19, with a large chunk of tax rebates for households being mailed out in the next few months to help consumption.
We would note (rather cynically) that based on history, the prospect of additional, and thus higher, Federal spending into elections is quite high, notwithstanding a consensus view that partisan politics will stymie extra spending in an Infrastructure Bill. Markets rarely seem to understand that fiscal spending tends to be dynamic and we have evidence that fiscal spending is picking up globally, be it from the EU (Germany, Italy and France are all set to spend substantially more as a percentage of GDP as most likely will UK), China, India (we are seeing Modi’s Bharatiya Janata Party government boosting handouts to farmers) or Japan (the government is expected to boost spending, including a package to offset the GST-hike set for October this year). Should a US-China trade deal materialise, these drivers, as they materialise in better GDP numbers by 2H19, could power the next leg of the rally in risk assets in the medium-term but stoke inflation in the long-term.
Equities
- The S&P 500 (+7.87%) saw a broad-based rebound from December’s decline, although gains varied as Energy and Industrials powered ahead, leaving defensives like Utilities trailing behind (Fig 2). The Technology sector was slightly mixed after heavyweights such as Facebook guided for lower growth, weighing on sentiment across the sector. However, others such as IBM rallied after posting strong earnings beats and better-than-expected guidance for FY19. The Dow Jones (+7.17%) and Nasdaq (+9.74%) also experienced a similar rally in January.
 Fig 2: Defensive sectors lagged in the S&P 500 Source: Bloomberg
- The STOXX 600 (+6.23%) also joined the rebound in global equities, with Telecommunications being the only sector to see a decline. This came after concerns over alleged spying by Huawei led to companies pulling out of ongoing 5G infrastructure developments (on top of pressure from the US), but also as investors grew weary of further delays and potentially higher costs in alternative providers. Within the index, just over 30% of companies have reported earnings, with 54.63% reporting an aggregate beat of +8.85%, and an aggregate earnings growth of +4.19%. On the other hand, over 44% of these companies saw earnings surprise to the downside.
- Nikkei (+3.79%, or +5.31% in USD adjusted terms) had a relatively poor performance against the broader MSCI AXJ (+7.79%). While the Shanghai Composite Index (+3.65%, or +6.40% in USD adjusted terms) lagged behind on continued USDCNY strength, the recovery in sentiment on Chinese equities was evident in the Hang Seng Index (+9.33%) which led gains across Asia.
- It is important to highlight that USD rates, relative to AXJ, are a good indicator in determining returns for equities in this region. Credit Suisse released an analysis some months back that showed AXJ equities outperforming their US counterparts by over 5% when the USD weakened by 5% or more, and vice versa when the USD strengthened. JP Morgan (JPM) backs this up in a research paper, showing that AXJ outperformed 100% of the time and on average by around 20%. Interestingly, many FX strategists are now predicting the USD to weaken significantly against currencies in AXJ, with the USD having been on a downward trajectory since October.
- A weaker USD coupled with far more stability in US equity markets (that have moved away from trade and bear market concerns) provide a scenario which is supportive for equities in AXJ. On top, EPS downgrades in this region over the past three months came in at -3%, which was less than the -5% decline in estimates for the S&P 500. The tail risk remains, however, that this could change rapidly, and that this market requires a close eye and strict risk controls.
- Looking specifically at China, it appears that markets seem to underestimate the degree of liquidity easing, tax cuts and reflation, in the same way that markets had arguably overestimated Trump’s one-off tax reforms in the 18H1. In our view, these are likely to cushion, if not support Chinese equities, and are drivers that other markets seem to be lacking.
- It was a somewhat eventful month for the US, after we saw resolution to the longest-running US government shutdown, but also as some economists continued to trim US GDP growth estimates for 18Q4 and 19Q1. Powell himself raised concerns over the potential impact of the shutdown, and some estimate that the shutdown may have trimmed 40bps off 19Q1 GDP growth alone.
- It is likely that markets continue to underestimate US political risks, with the recent government shutdown potentially a foreshadowing of an even larger tussle when government funding runs out in September. Additionally, developments around the Mueller investigation also point to a genuine risk that he may indeed have a ‘smoking gun’ tying Trump to the Russians, which could prompt the latter to shut down the investigation entirely. Either scenario could potentially trigger a constitutional crisis. The greater concern for markets, is Trump’s unpredictability which ratchets up as he comes under pressure, particularly if it relates to legal or constitutional pressures.
- Evidently, these looming risks are sufficiently negative to have significant implications for the US market, more so if we see both intensify at the same time which is not at all unlikely given Trump’s history. We need to remain cautious around 19H1 beyond these two risks as they exacerbate the broader US/global GDP slowdown, weaker EPS growth, and uncertainty over whether Powell made a mistake in tightening too far. Our base case remains that these fears are exaggerated and will likely be reduced over time as hard data provides greater clarity over direction and quantum.
- Given this, we are cautiously optimistic on a positive outcome on trade in the near term. Trump continues to face pressure from blame over the recent shutdown, weakness in the US equity markets have investors questioning the US growth outlook, while Xi is likewise tackling the impact of multiple factors which have led to China’s slowing economy. Both have incentive to ensure that some degree of progress around trade negotiations are secured at least in the near-term.
Fixed-Income
- Sovereign debt was relatively flat in January as the market turned mostly risk-on. US Treasury (UST) yields rose sharply at the start of the month as investors turned risk-on following a blowout in December’s NFP numbers and rotated out of the safer government debt. The UST yield curve saw a parallel shift downwards, with greater falls in yields in the 5Y to 10Y period (Fig 3), following a dovish announcement by the Fed that led markets to think that rate hikes might be on hold. Bunds sold off early in January, along with USTs, but yields trended lower through the month as weaker economic data weighed on sentiments.
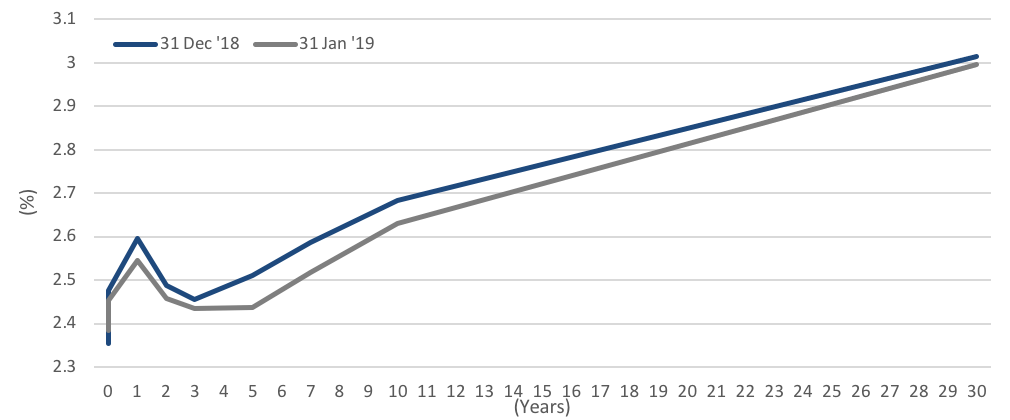 Fig 3: Yield curve shifts lower in January Source: Bloomberg
- Credit also saw a positive return across all sectors, as spreads eased lower after reaching 2016 highs in December. The risk-on mood saw US HY gain the most, finding support from fund inflows, steady US economic data, rising oil prices and a dovish Fed. The Bloomberg Barclays US HY index gained 4.52%, its largest January return since 2009 (Fig 4), with CCC-rated bonds jumping 5.29% while BB yields fell to a 4M low of 5.32%.
 Fig 4: Junk bond comeback Source: Bloomberg
- Bloomberg data also showed EM debt issuance reaching $172bn MTD. This is more than any January on record as borrowers took advantage of the strong demand from the turn in sentiment toward risky assets in January.
- We think Powell’s dovish comments might not be entirely a good thing. Powell seems to have overcompensated for 4Q18, and is simply giving the markets what they want to hear with no clarity. The Fed’s pandering to markets led several sell-side banks like GS, JPM and BofAML to think that the UST 10Y yield might have peaked for this cycle, causing them to cut their year-end projections.
- However, we think the US economy remains robust, as evidenced by the strong January NFP and ISM manufacturing PMI numbers. This, coupled with the US Treasury’s expected issuance of $365bn in debt in 1Q19 ($8bn more than its previous estimate) to finance its widening deficit, should provide upside pressure for UST yields.
- We maintain our conviction in shorter-duration debt given its defensiveness against interest rate risk. We continue to like HY debt as we believe there is still room for growth, and fundamentals for the sector remain strong. Analysts have also expressed a similar view, with the likes of Wells Fargo and Barclays upgrading their annual forecasts of US HY returns to 9.9% (from 6%) and 6.5%-7.5% (from 3.5%-4.5%) respectively.
FX
- A dovish Powell caused weakness in USD during the start of January, which has been reflected in the recovery of AXJ currencies after last year’s decline. The DXY tested 95.300 twice – once during the first week of January and the other on 30th This level is just above the 200DMA found at 95.371. We remain moderate dollar bulls on the basis that the US economy remains strong and positive data will lead the Fed to resume raising rates.
- JPY strengthened to 108 in the first half of January on dollar weakness, which is also a resistance level, ignoring the flash crash to 104.96 early January which resulted from trading on thin liquidity. Unsurprisingly, BOJ left rates unchanged and lowered its near-term GDP forecasts. This, along with relatively stronger data out of the US are factors that could lead the JPY lower to 110.
- Amongst AXJ FX, THB (+4.06%), IDR (+3.27%) and CNY (+1.94%) have been leaders YTD (Fig 5). Strength from the Thai baht has been attributed to the 25bp rate hike in December as well as an increase in Thai equity purchases from global funds.
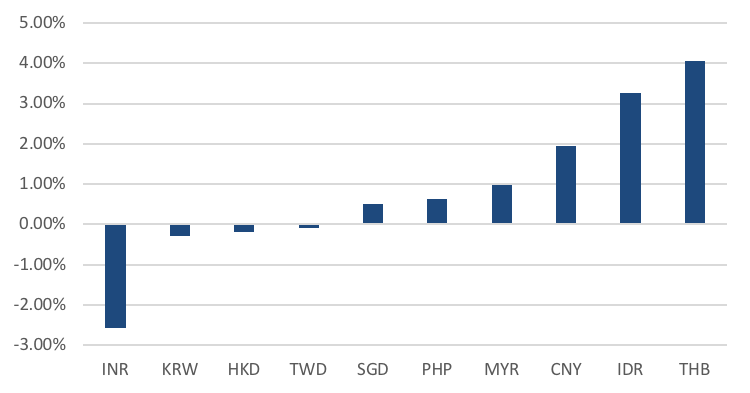 Fig 5: AXJ FX total returns against USD as of 6th Feb ‘19 Source: Bloomberg
- CNY strengthened greatly to c.6.70 in January on dollar weakness and optimism around trade, weakening toward the end of the month as this sentiment waned. A few data releases also added to uncertainty over China’s economic trajectory, which also weighed on the currency.
- The course for AXJ FX will be dependent on three aspects, the Fed (US data), the CNY (US-China trade negotiations) as well as the Brent price. We may see some downside pressure over the next month or two until we see a recovery in macroeconomic data. USDCNY’s bounce off its 6.70 resistance in January (and a move back above the 200DMA) implies this. THB will likely hold against its 31.132 resistance, following BOT’s recent decision to leave rates unchanged.
- Much of the directionality for the EUR or the GBP lies in the fate of Brexit. We think that the BoE will unlikely change its monetary policy until there is clarity around Brexit. We expect an extension to Brexit’s deadline, hence reducing the likelihood of a ‘hard’ Brexit. This should be supportive for the GBP in the medium-term.
COMMODITIES – REVIEW
- Brent oil recovered from its 52W low of 50.47 in December to end January at 61.89 on the back of a weaker USD. Venezuelan sanctions contributed to the bullish sentiment around oil, with the cold spell in the US boosting fuel demand. This 15.04% MoM gain was its largest since April 2016, but it now struggles to move past a technical resistance level of 62.80.
- The oil rally since December’s low has also led to significant short covering. ICE data showed that shorts fell 27% in the week ended 29thJanuary to their lowest point since October ’18, while long positions held by hedge funds increased by 15%.
- Oil will remain attractive below its technical resistance of 62.80, but the direction of oil will require clarity on key issues such as China’s economic slowdown and in turn, AXJ’s demand for oil; US’ output and OPEC’s ability (and Russia’s willingness to cooperate) to pull through with their cutbacks in production. These short-term headwinds may only be rectified as we move past 1H19.
- Gold began a new trend, borrowing strength from uncertainty and increased volatility in the markets as we ended 2018. The dim outlook for the dollar at the start of ‘19 also supported gold through the month, as it broke above the $1,300/oz level to end the month at $1,321. However, it failed to break significantly above the $1,320/oz level and pared some of the gains in the first few days of February (Fig 6).
 Fig 6: 1Y gold chart Source: Bloomberg
- Dollar strength was the main contributor in Gold’s recent losing streak, but the precious metal has followed its 20DMA rather closely, which suggests that the uptrend may still be intact (Fig 6).
- With investors betting that the Fed may now be on hold, and as the global economy slows and volatility picks up, gold offers an alternative safe haven to FI. Last year, speculative positioning was reduced substantially and central banks bought the most gold since ‘71. With these in mind, we may see gold push higher to test multi-year highs of around $1,360/oz.
CONTACT
We would be more than happy to have an informal chat about these and the other services we offer as well as the current opportunities we are looking at.