
Markets were risk on at the start of January on the back of optimism around the successful signing of the US-China phase one deal and the easing of US-Iran tensions. However, that was quickly forgotten and reversed following the coronavirus outbreak, which led to an extended holiday in China and the cancellation of several inbound flights to China by multiple airlines. Fears around the virus eventually impacted the tourism and retail sectors, and weighed on sentiments around global growth, leading to selloffs in the latter part of the month.
Fears around a slowdown in global growth directly impacted oil prices, with the Brent oil price erasing its Dec ’19 gains while it heads lower towards a near term support of $50. Inversely, Gold climbed further to reach highs of $1,611 per ounce before stabilising between $1,580 and $1,550 amid risk-off sentiments
Global equities fell, ultimately dragged lower by Asian equities which bore the brunt of the coronavirus selloff. In fact, the month ended with most major equity indices in the red YTD, with only Nasdaq remaining positive. However, the tapering of concerns around the virus in the first week of Feb saw US equities continue to outperform other regions and eventually went back on track to notch fresh all-time highs.
The risk-off sentiment throughout January also helped support Fixed Income (FI) as demand for sovereign debt, notably US Treasuries (UST), increased. This led to the UST 10Y yield falling to key support of c. 1.50% at the end of the month before rebounding in the first week of Feb. Fund flows into higher quality bond ETFs also dominated this month as markets took risk off amid concerns that the virus will impact corporate earnings.
The risk-off sentiment also led to increased volatility in the FX market and saw the USD strengthen considerably, with the DXY climbing to 98.50 in the year to 6th Feb – its highest in four months. On top of concerns around the coronavirus, GBP also weakened last week amid potential UK-EU trade complications after Johnson and Barnier clashed over rules around post-Brexit trade arrangements.
OUTLOOK
We would simply ascribe a one-third chance it gets much worse with infections climbing until Q2 having a much greater impact on GDP growth in China, Asia ex-Japan and even globally; one-third chance markets are pricing in virus where we are now, i.e. nasty but only having a short-term; one-third chance we see infection rate stabilise and peak in Feb, thus allowing a further risk rally.
There is danger markets get too optimistic too soon. However, China’s unilateral decision to halve trade tariffs is clearly positive, especially if Trump responds graciously. There is no doubt the virus is Xi Jinping’s biggest challenge since taking over in ’12 and he has no one else to blame. He, and the Communist Party of China (CCP), have suffered an enormous blow to their prestige, competence and the China ‘model’.
The only way he, and CCP, can respond is to throw everything they can at containing this virus and to more aggressively reflate the Chinese economy. By jettisoning trade tariffs, Xi is putting the economy ahead of principle. This is positive for the economy and for equities and reduces risk.
Elsewhere, S&P 500 companies’ earnings reports in Q4 are beating consensus forecasts handily whilst recent macroeconomic data in the US is positive, as is a robust ADP report. These are fundamentally important for risk assets. Whilst we should be cautious in the short-term now equities have rebounded strongly with US equities at fresh all-time highs, the medium- to long-term case that there is no alternative (TINA) to equities remains in place.
EQUITIES
The S&P 500 (-0.16%) lost most of its mid-month gains to close the month mostly flat (Figure 1), while DJIA (-0.99%) performed likewise, weighed lower by a steep decline in Boeing. Nasdaq (+1.99%) managed to hold on to some gains, with tech stocks again outperforming on the back of several earnings beats from the likes of big hitters such as IBM and Facebook.
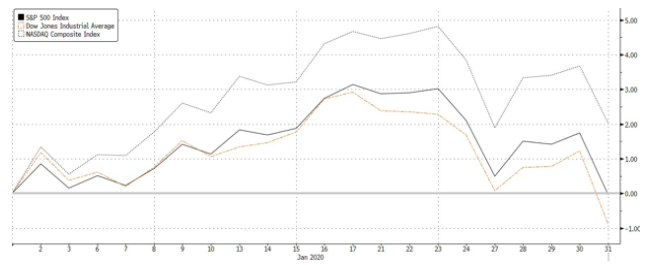
Figure 1: US major indices’ returns in Jan ’20. Source: Bloomberg
The risk-off appetite from investors saw moves out of Materials, Financials, and Healthcare, while Utilities outperformed alongside IT, which remained surprisingly resilient despite the run-up it had already seen. Energy underperformed significantly, though understandably so as oil prices likewise came sharply off Jan highs (Figure 2).

Figure 2: S&P 500 sector returns in Jan ’20. Source: Bloomberg
Macroeconomic data was generally supportive in Dec, with ISM Manufacturing PMI rebounding sharply in Jan to 50.9 (vs est. 48.5), while CPI rose 2.3% YoY (vs est. 2.4%) in Dec. Housing starts rose 16.9% MoM (vs est. 1.1%) to a 13Y high as lower mortgage rates, along with higher wages and low unemployment helped buoy demand. Overall, GDP grew at an annualized 2.1% on 4Q19 (vs est. 2.0%), the same as the prior period although consumer spending moderated, and business investment continued to deteriorate. Notably, NFP also fell short of expectations, rising +145k in December (vs. est. +160k) although this came after a strong print in November.
Earnings season is also ongoing, with close to half of all S&P 500 companies having reported as of 31st Jan. Of the 45% that did, 69% reported a positive EPS surprise, while close to two-thirds reported a positive revenue surprise. The current estimated earnings decline in 4Q19 sits at roughly -0.3%, while estimates sit closer to -1.6%.
Shares in Europe were likewise down across the board (Figure 3), with shares in the UK leading losses, while the French CAC 40 trailed behind. In terms of data, German manufacturing PMI in Jan rose to 45.2 (vs est. 44.5), while the overall Eurozone figure came in at 47.9 (vs est. 47.8) compared to 46.3 a month earlier. The move, despite it still being a contraction, is its strongest reading since April 2019. Separately, ECB’s chief economist expressed his view that rising labour costs would eventually re-ignite inflation in the region, expressing confidence that the ECB was on track toward its inflation goals.

Figure 3: European major indices return in Jan ’20. Source: Bloomberg
Utilities outperformed significantly, no doubt a result of a risk-off move into defensives, while Basic Resources and Oil & Gas were key laggards. Autos underperformed significantly amidst renewed fears that Trump would impose stricter tariffs on European carmakers (Figure 4).

Figure 4: Stoxx 600 sector returns in Jan ’20. Source: Bloomberg
Asian markets bore the brunt of the selloff, with the MSCI Asia ex-Japan Index (-5.16%) logging steep declines, while the SHASHR (-2.41%) and HSI (-6.66%) were still on their Chinese New Year holiday. Nikkei (-1.91%) also closed lower, while MSCI ASEAN (-5.16%) underperformed the broader region.
In Asia, equity markets were undoubtedly alleviated earlier in the month by the news over trade – China understandably one of the top gainers in the region. HSI also rallied, in part off the back of this news, but also as tension on the streets appeared to have tapered off toward the holiday season. Overall, the MSCI Asia ex-Japan gained, while Japan and Sensex lagged the broader region. This was however quickly erased following the outbreak of the coronavirus.
New data also showed China’s GDP grew +6.1% in ‘19, down from +6.6% a year earlier to its slowest pace in 29Y. The results were, however, largely in-line with economists’ expectations and the government’s target of 6% to 6.5%. Industrial output grew 6.9% in ‘19 (vs est. 5.9%) while FAI picked up for the 1st time since June to grow 5.4% in ’19 (vs est. 5.2%), signaling a firmer recovery could be underway.
FIXED INCOME
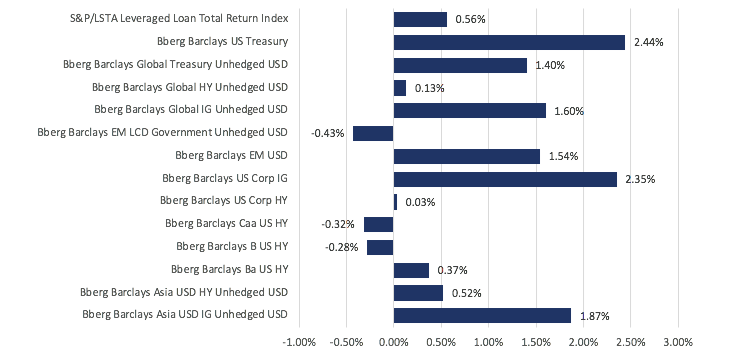
Figure 5: FI sector returns in Jan ’20 Source: Bloomberg
Fixed income markets were risk-off as well as we saw rotation into higher-quality debt. Flows moved back into sovereign debt, with USTs outperforming all other sectors in the asset class (Figure 5). Prices rose and yields fell across the UST curve, with the 10Y yield falling to a support at c. 1.50%. This led to duration spreads flattening (Figure 6), with the 3m/10y inverting momentarily towards the end of Jan, reviving memories of growth fears seen last year.
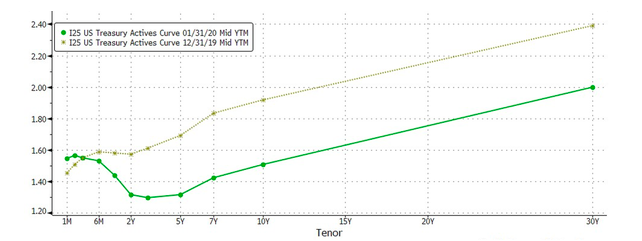
Figure 6: UST yield curve comparison between Dec’19 and Jan ’20. Source: Bloomberg
The FOMC also had its first meeting of the year and kept its key interest rate unchanged while indicating that monetary policy will stay on hold. Markets expected this and had little reaction to the news. However, the FOMC raised the IOER and overnight repo rates by 5bps each to 1.6% and 1.5% respectively and said it would continue expanding its balance sheet into 2Q20. It also tweaked its language to say that current monetary policy is appropriate to support inflation “returning” to the 2% target, from saying prices were “near” the goal. Powell clarified in his post-meeting comments that the new language was meant to clarify that the central bank is “not comfortable with inflation running persistently below” the 2% goal.
Looking at other parts of the world, JP Morgan estimates that the net supply of euro-area sovereign bonds this year will amount to EUR 188bn, the lowest since ’08. This comes against a backdrop of lower borrowing costs and is lower than the EUR 240bn ECB pledged to buy under its bond-buying program. The expected slowdown in issuance of sovereign debt in the region saw auctions in Spain and Italy during the month draw record demand.
Global credit spreads all widened too, though a fall in sovereign yields helped cushion the impact. US HY spreads widened the most to reverse the narrowing seen in Dec (Figure 7) as concerns around the coronavirus, and its potential impact on the economy and corporate earnings led investors to pull funds out of the sector. UBS noted that the concerns around the virus led to $2.2bn worth of outflows from bond funds since 24th Jan. Global HY issuance was also strong up till the last week of the month. Data from Dealogic showed that global HY bond issuance in Jan amounted to $73.6bn, exceeding any other monthly total over the past 25 years.

Figure 7: Credit spreads widen to reverse Dec’ tightening. Source: Bloomberg
Elsewhere, JP Morgan credit analysts have lowered forecasts for US HY returns, spreads and yields for ‘20 following a strong rally for the debt in Dec. It slashed its return outlook to 6% from 7.5% initially seen in late Nov. YE20 yield forecast was also cut to 6% from 6.25% and spreads to 425 basis points over Treasuries from 440bps. This does not change our preference for riskier debt over IG as valuations in the latter remain rich. However, given the late-cycle environment, we are in, we continue to advise investors to remain cautious when dealing with the riskier end of the credit quality curve.
Concerns around the virus also affected primary issuances in AXJ. Prior to the escalation of the illness, sales of Asia dollar bonds rose to $42.5bn in Jan – a record for issuance levels in any Jan. However, the virus, coupled with the Lunar New Year holidays, saw issuance come to a standstill in the last two weeks of Jan. Despite this, we remain positive on AXJ FI. On top of the reasons highlighted last month – reflation in Asian economies; positive technicals – we remain of the view that central banks in Asia have the willingness, and the ability, to cut rates still. Apart from wanting to support their economies amid the viral outbreak, central banks will undoubtedly move to cut rates to prevent their currencies from strengthening too much as the hunt for yield brings fund flows into the region.
FX
Concerns around the coronavirus saw USDCNH break above 7 again momentarily and caused a spike in volatility in the rest of the world. As for the rest of Asia, investors began to assume the worst; tourist and export-based economies such as Australia (AUD -3.74%), Thailand (THB -3.69%), S. Korea (KRW -2.86%) and Singapore (SGD -2.86%) were affected the most YTD (6th February).
The relative outperformers YTD in Asian FX were IDR (+1.67%), INR (+0.26%), PHP (-0.24%) and VND (-0.20%) as investors favoured higher-yielding FX and as oil prices fell. In the G7 space, JPY experienced a healthy bout of volatility as traders rode the 107 to 110 range as shown by positions as uncertainty rocked markets (Figure 8).
The remainder of the G7 currencies also weakened as the ultimate haven, the dollar, supported by the resilient consumer, once again led the charge. The DXY climbed from 96.40 to 98.50 YTD (6th February). GBP and EUR also led losses (aside from AUD) as traders unwound longs (GBP) and remained bearish (EUR).
In the coming months, aside from an overall slowdown/weakness in FX, we continue to see further weakness in the AUD, THB, KRW, and SGD as the economic damage from the coronavirus seeps its way into trade-related data and of course, tourism.
However, the damage is reparable. Countries affected by the coronavirus have reacted much quicker to contain, mitigate and attempt to treat the virus. Although we understand the asymptomatic attribute may drive fear, we do not believe this fear will last forever. China, much different than it was in ‘03, is much more capable in stabilizing and stimulating its economy using state-owned entities. Like we have seen for the second time on 31st Dec, the RRR rate was cut once again and as we write this, China has ordered state-owned funds, lenders as well as brokerages to pump liquidity to virally affected parts of its economy.
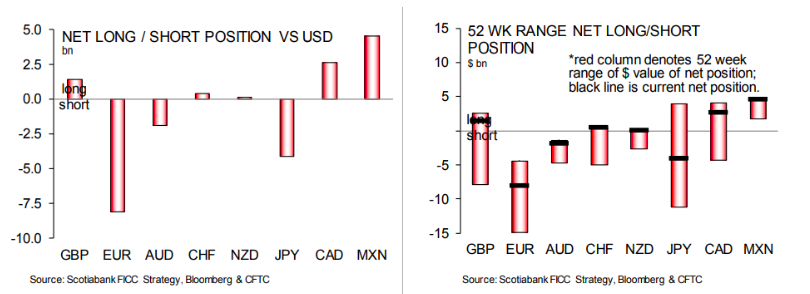
Figure 8: Long/Short Positions against US.
COMMODITIES
The Brent oil price experienced a tumultuous start to the year as it fell from its high of $71/bbl (from Iran-US tensions from the death of Iranian General Soleimani and the signing of Phase One of the trade deal) before ultimately falling amid fears of a global slowdown from the coronavirus. This prompted a rapid unwinding of long positions that caused Brent to reverse all its gains from Dec ‘19 (Figure 9).
Inversely, Gold climbed further to reach highs of $1,611 per ounce before stabilising between $1,580 and $1,550.
We believe that the virus will continue to take center stage for commodities and metals as the demand for energy falls, particularly due to the slowdown of auto-manufacturing economies in Asia. This will, in turn, lead to a build-up in inventories as we believe demand growth will slow for the better part of ‘20.
We see further room for Brent to fall before finding support at the $50 region due to three reasons – a recent OPEC+ emergency meeting was called for (OPEC+ officials recommended 600kbpd of additional cuts in output, but Saudi Arabia and Russia are at odds around this decision); positioning still places investors net-long and therefore more room for a sell-off; the coronavirus’ pressure on China might hamper its growth in the short-term and affect near-term demand (some Chinese commodity companies are reportedly claiming force majeure on some of their contracts).
Although concerns of the coronavirus infection rate will continue to weigh down on oil, we believe OPEC+ policy revisions and a slowdown in fears (as markets tend to do) will place a floor on the oil price within the coming month.

Figure 9: Chart showing WTI Oil vs Net Positions.