Equities fell momentarily into a technical bear market on Christmas Eve amidst growing concerns that the Fed is raising rates into a slowing global economy, evidenced by weaker manufacturing and other various economic data released over the month. Thin trading through the month worsened the losses. The MSCI ACWI fell to 435.90, 20.84% off its 52W high, before ending the year at 455.66 to register a 11.18% loss for 2018. Most major equity indices also fell into a technical bear market over Christmas (Fig 1). However, the Fed also trimmed its 2019 rate increase projections to two increases from three and lowered the long-term equilibrium Fed rate to 2.75% from 3%.
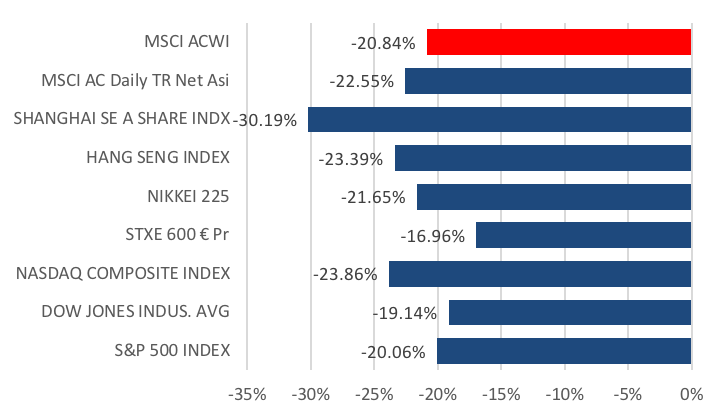 Fig 1: Global equities fall into bear market over Christmas Source: Bloomberg
There were several developments in the Sino-US trade situation as well. In the first month after Trump and Xi’s meeting at the G20 conference, we saw China cutting US auto tariffs from to 15% from 40% and making a huge purchase of US soybeans while Trump cited huge progress in trade developments after a phone call with Xi. There were concerns that the arrest of Huawei’s CFO might jeopardize the discussions, but these worries were short-lived.
Brexit developments, however, took a turn for the worse earlier in the month after May delayed a parliamentary vote on the Brexit deal, survived a vote of no confidence and stepped up preparations for a ‘hard’ Brexit. This chain of events led to a volatile month for the GBP, which traded -2.13% to a low of 1.2478 before ending the month almost flat.
We suggested last year might start well, turn tricky and become difficult, but we were surprised by the speed of the changes and, in particular, the severity of the fall in the S&P 500 in December. 1969 was the last time all asset classes struggled and cash outperformed. Our base case for 2019 is it will likely be an uncertain and volatile start but, as we potentially get more clarity over key risks, conditions may become more constructively for risk assets in 19H2.
We are not bearish and do not see a ‘smoking gun’ that will devastate markets. We believe markets are suffering another growth scare often seen since 2010, with 2017 the exception. We doubt a recession is imminent in the USA or globally, nor do we anticipate an earnings contraction either. We believe markets have already discounted a lot of bad news but are ignoring some positives, such as the largest, synchronized fiscal expansion since 2010.
Our base case is predicated on these assumptions: A Sino-US trade deal is desired by both the USA and China; a ‘soft’ Brexit is the probable outcome, albeit it could be delayed; Italy will agree a budget deal with the European Commission (EC) and remain in the EU; China will support its economy sufficiently to defend a 6%+ GDP growth and ensure CNY’s stability; the Fed will raise rates two times in 2019 and then be driven by the data; and that the US GDP will grow at a solid 2.5% in 2019 and global GDP growth will be solid. Should we be wrong and a ‘bear’ market in equities occur, we see a probable Powell ‘put’ limiting the downside.
Tactically, we see the first few months of 2019 as a ‘tricky’ period. Global GDP growth and EPS will slow, and it may take until late April – with Q1 results coming out – to provide jittery investors with a better clue as to the direction for US/global EPS. Likewise, we need to see the spate of GDP downgrades stabilize. Whilst we remain optimistic a trade deal will occur, Trump’s negotiating style may result in fears of a global trade war, including the risk of global auto tariffs, remaining high and this is most investors’ key risk.
Equities
- December was particularly harsh, as all three major indices in the US were down close to -9% over the course of this month. The S&P 500 saw a broad-based decline across all sectors (Fig 2), with Energy (-12.82%) leading losses as global oil prices declined on high inventory levels and weaker economic growth outlooks. Financials (-11.45%) and Industrials (-10.81%) were also particularly hard hit, no doubt a result of dampening expectations for interest rates, and the ongoing trade-related issues with China.
 Fig 2: All S&P 500 sectors ended December lower Source: Bloomberg
- The Stoxx 600 had a relatively better month than Wall Street, falling -5.55% MoM to finish the year -13.24% lower. The index saw a broad-based decline, with Retail (-7.98%), Banks (-7.70%) and Autos (-7.21%) leading losses. It was also a down month for the FTSE 100, which fell -3.61% MoM.
- China A-shares fell 3.65% in Dec to end the year 24.60% lower, while the HSI likewise declined 3.78% to finish FY18 14.60% lower. Despite some positive developments around the 90-day US-China truce, an early rally by Asian equities quickly subsided as negative sentiment continued to weigh on investors, as evidenced by the -2.93% MoM decline in the MSCI Asia ex-Japan Index. Data releases did not provide much needed respite either – in China, industrial profits fell for the first time since 2015, as November trade data surprised on the downside as exports struggled despite tax rebates and a weak currency, while a slowdown in imports highlighted slowing global trade and a weakness in domestic growth.
- China’s Central Economic Working Conference was also held this month, with the outcome being a renewed focus in stabilizing economic growth through policy stimulus. There was also quite a bit of focus on PBOC’s newly announced Targeted Medium-Term Lending Facility, aimed to provide low-cost liquidity to smaller companies.
- The fundamental question for 2019 is whether the deteriorating growth environment will negatively impact US growth. The short answer is yes, but not materially. In a recent report, Goldman Sachs (GS) notes that slower global growth could affect US growth through 1) the reduction of demand for US exports 2) a reduction of US business investment spending and 3) tightening of US financial conditions. While we might see this play out over the course of 1Q19 (and GS predicts that this could trim 0.4% off US growth), the economy should be strong enough to cope with this negative drag (Fig 3)
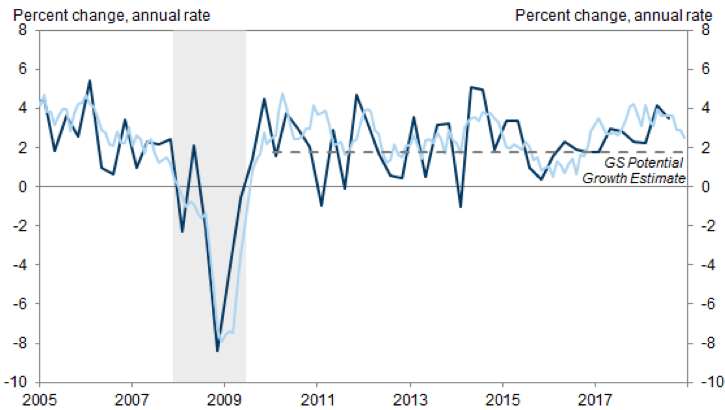
Fig 3: US Growth Remains Solid Source: GS Global Investment Research
- Tail risks continue to be an escalation in the Sino-US trade dispute, and a sudden spike in inflation which could force the Fed to raise rates far more aggressively than the market currently expects. UBS predicts that this could result in a flat or inverted yield curve somewhere in the middle of the year, followed by sell-offs in the equity market, which could set the stage for an early recession in 2020.
- Brexit remains the biggest geopolitical risk in the Eurozone, because the outcome remains largely uncertain. While the impact may be more contained within UK/EU, odds are for a weaker and potentially volatile GBP as the process drags on, dampening Capex prospects and continuing the overhang on GDP growth. The next key date to watch is the week of 14thJanuary, where May’s delayed ‘meaningful vote’ is scheduled to take place.
- Earlier in September, we posited that China’s policymakers faced an increasingly difficult balance between policy decisions, and that every subsequent move would result in elevated costs and risks. Daiwa highlights that we saw this unfold numerous times over the past few months, as the PBOC took to defending the CNY at the 7.00 mark. While a fall below this level would have negative implications (i.e. capital flight), the result has been 1) denying a downward adjustment which would have been supportive of export competitiveness and 2) Offsetting a good deal of stimulus effects from both fiscal and monetary measures, as we have observed from the continued weakness in data toward the year-end.
- We expect more guidance by the PBOC in early March, particularly around growth targets which are slated for announcement during the National People’s Congress meeting. It is widely expected that the government will maintain an expansionary fiscal policy and much like 2018, the consensus is for another four 50bps cuts to the Reserve Requirement Ratio this year. The positioning of the Chinese government has clearly turned toward an easing stance with more measures expected to come in 2019.
Fixed-Income
- Sovereign debt rallied sharply in December as weak economic data raised concerns of a global growth slowdown and increased demand for safe haven assets. The UST yield curve shifted lower through the month, with the 2Y UST yield falling 29.87bps, the most since June 2016, while the 10Y UST yield fell 30.37bps, its largest decline since January 2010. The 2Y-10Y spread remained largely unchanged at 19.64bps at the end of December. The Bunds yield also fell 7.1bps over the month and continued falling in the first week of January to reach its lowest level since April 2017. However, sovereign yields saw a pick up on 5thJanuary after a strong NFP number and Powell’s reassurance that the Fed will not rush to raise interest rates helped ease concerns.

Fig 4: Bond spreads reach highest levels since ’16 Source: Bloomberg
- Credit also saw positive returns across the sectors, with spreads reaching its highest levels since 2016 (Fig 4). US IG bonds gained the most in December, with the Bloomberg Barclays Global US Corporate Total Return index up 1.47%, despite IG bond funds seeing six straight weeks of outflows (Fig 5). Investors withdrew $17.8bn from IG bond funds in December. This helped pare its losses in 2018 to -2.51%.

Fig 5: US IG bonds see six straight weeks of outflows Source: Bloomberg, Lipper
- HY debt underperformed in December as it tracked equities and oil prices lower. US HY performed the worst in December, with the Bloomberg Barclays US Corporate HY Total Return index falling 2.14% while spreads widened to 526bps, just shy of the 30M peak set on 27th December’s performance caused the US HY sector to end the year -2.08%, resulting in its worst year since 2015. HY bond funds also saw seven straight weeks of outflow, with $8.2bn withdrawn in December.
- However, issuance dried up in December. US IG bonds went through the last three weeks of December without any issuance and ended 2018 with $1.08tn in issuance, falling 11% from ‘17’s $1.21tn amidst a combination of higher borrowing costs and overseas cash repatriation. There was also no issuance of US HY debt in December, the first time in over 10 years.
- US HY now appears to be of value, given the levels it is currently trading at – 7.95% yield with a 5.26% spread. Sell-side forecasters are expecting US HY to bounce back in 2019 (Fig 6). Key drivers of US HY bonds – default rates, earnings, GDP growth, corporate cash flow – also look to be generally supportive. However, despite its cheaper valuations, US HY presents higher risk given the near-term uncertainty, higher volatility and tighter financial conditions. BofAML raised its US HY default rate estimate for 2019 to 5.5% from 4.25% and suggests a risk neutral spread of 5%, relative to 5.3% currently. It is necessary, even more so now, to be selective of better-quality names in this space. Given the amount of uncertainty in markets now, we continue to recommend sticking with short duration debt.
|
US HY ’19 Expected Returns (%) |
Leveraged loans ’19 Expected Returns (%) |
|
| JP Morgan | 3.25 | 6 |
| BofAML | 2.4 | 4 – 5 |
| Citibank | 2.7 | 3.3 |
| Morgan Stanley | 0.5 | 1.3 |
| Wells Fargo | 6 – 7 | 3 – 4 |
| UBS | 5.6 | 4.3 |
| Barclays | 3.5 – 4.5 | 4.5 – 5.5 |
Fig 6: Sell-side expectations for US HY and Leveraged Loans Source: Bloomberg
- European credit will likely be a difficult space to trade in this year as investor sentiment wanes. This year, the region faces risks in the form of Brexit uncertainty and a slowdown in global and European growth. In addition, with the ECB stopping net asset purchases and only reinvesting its maturing holdings, it removes a safety net of sorts, worsening liquidity in the space.
FX – REVIEW
- December’s biggest move in currencies was the USDJPY, which fell 3.42% in December, and continued its decline in early January to a low of 104.87 before recovering back to the 108 region. The decline came as disappointing US data sparked fears over a US slowdown, spurring a risk-off move to the ‘safe haven’ JPY.
- The JPM EM FX Index was mostly unchanged at 62.221, falling 0.5% for the month. Within the index, there was notable resilience in the USDTHB, which instead moved -1.02% from 32.885THB to 32.548THB, strengthening even further against the Dollar in early Jan to 31.965THB.
- This month also saw the DXY break its 50DMA support at 96.6 to fall -1.13% in December, finding a new support from its 100DMA at the 96.0 level. The EUR gained 1.33% against the dollar for the month, but also mostly from general Dollar weakness over slowing growth in the US.
- The base case this year is a complicated one, but we are more inclined to think the Dollar will likely end the year in a weaker position. While appearing to be overvalued on a fundamental basis, there are still too many reasons why uncertainties will keep its ‘safe haven’ status supported especially over the first half of the year.
- Moves in the GBP will still largely be dependent on news surrounding Brexit. As discussed earlier, a no-deal scenario could potentially send the sterling significantly lower from where it is now, and that situation might present a short-term opportunity for a tactical trade. Our base case is more likely a soft deal (rather than a no-deal situation), which should support the sterling as well as the euro.
- We are cautiously optimistic that EM Asia currencies could rise against the dollar over the next few months, if not more so in the second half of 2019. As we have witnessed over the course of 2018, this will also largely depend on how the CNY moves, as a no-deal trade scenario between the US and China could potentially send the Chinese currency below 7 and that would have a contagion effect onto the rest of Asia.
COMMODITIES
- The growth scare in December led Brent oil prices to extend its November losses, leading to an 8.36% loss over the month. Oil prices were volatile, initially supported by OPEC’s pledge to cut output after the meeting in Vienna before concerns around global growth and rising supply from Russia and US eventually weighed on prices.
- Gold gained significantly over December, rising 5.08% through the month past a key level at $1,250/oz, as markets saw a flight to safety amidst the uncertainties in the month.
- We are bullish on oil prices are see it averaging $70/brl with further upside from here. Our base case is for a Sino-US trade deal, hence reducing concerns of slowing global growth and offering greater clarity into oil demand. OPEC+’s agreement to lower output will officially begin this month and should provide support to oil prices.
- We see technicals supporting Gold from here on and expect it to trade in the range of $1,250 – $1,320/oz.
CONTACT
We would be more than happy to have an informal chat about these and the other services we offer as well as the current opportunities we are looking at.