
All asset classes had an extraordinary year in ’19 with most far surpassing their 10-year averages (Figure 1). Geopolitical uncertainty saw various asset classes move sideways for almost the first half of the year, but markets picked up once we saw clarity.
Equities were easily the best performing asset class with US indices leading the charge to close the year at new all-time highs. Gains in the asset class were driven largely by expansion in multiples – more so in the US than in any other region – making equities more expensive in absolute terms. Fixed income also saw robust gains across the board as investors hunt for yield. This year saw negative-yielding debt reach $17tn at its peak, pushing investors either further down the duration curve or towards lower quality credit, thus allowing global high yield (HY) to outperform the other FI sectors.
Gold had its best year since ‘13 and rose to a new 6Y-high as investors, especially in Q4CY19, embraced its merits as a safe haven asset and portfolio diversifier. ‘19 was a year of record low FX volatility with DXY up just 22bps as USD sold off against rest of world (ROW) FX in Q4 having been up c. 2.5% at the end of Q3CY19. Oil also rose strongly for its best year since ‘14 – again much of the gains seen in Q4CY19 after OPEC cut production further and then SAUDI ARABIA additionally cut more.
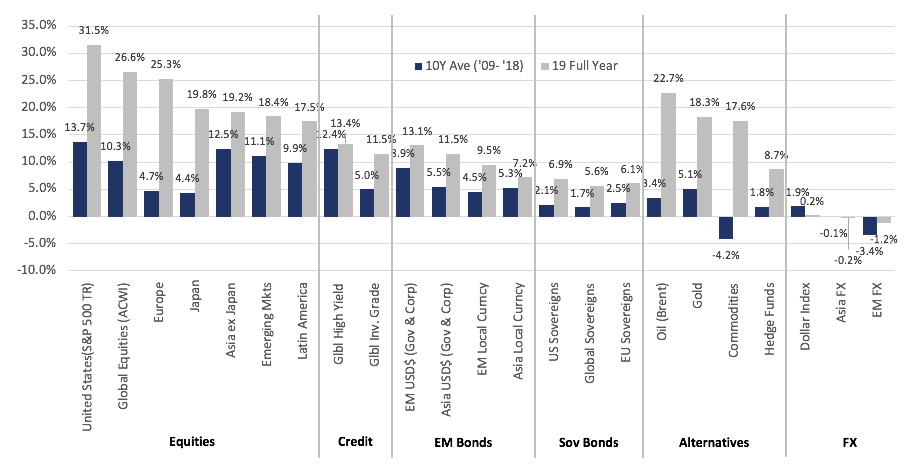
Fig 1: Global multi-asset total returns. Source: LGT, Bloomberg
OUTLOOK
We are risk-on as we start the new year. While we are still bullish on equities, we see relatively less value in US equities having seen its performance last year. The expansion in multiples of that magnitude in the US will eventually need to be supported by earnings growth. However, we think that the probability of that happening is low given the US is late-cycle with regards to expansion and faces a slower economy this year on a YoY basis relative to others which might be stable, or even better (EMs especially). A number of people see US equities underperform equities in ROW in ‘20 given potentially relatively weaker earnings per share (EPS) growth of c. 5% in FY20 relative to the 10%+ for ROW.
In addition, US equities also face potential political/regulatory headwinds – some of which have bipartisan support – and higher barriers to monetary/fiscal policy action bar a material slowdown. This compares with economies in other parts of the world that has more capacity for further monetary easing or fiscal reflation (which we already saw in Japan and might potentially see in Europe).
However, we see relatively less value in FI and are underweight the asset class. We do not see anything in the near-term that will cause a blow-up in the space but acknowledge that there are greater risks here compared to equities – there is the possibility of ‘fallen angels’ in BBBs; defaults in leveraged loans. Moody’s also argued that US HY FI is overvalued with unattractive risk-reward compensation given how spreads have tightened considerably in’19.
Within the FX markets, there are strategists arguing for USD relative weakness – notably against emerging markets (EM) currencies/JPY. Whilst we can see risks for USD in ’20 – important as a driver of portfolio flows to ROW equities and EM equities more so – equally, we’d want to see a clear trend of USD weakness develop before being too bearish. We struggle to be too negative on it as opposed to other developed markets (DM) FX. Gold has merit as a ‘safe haven’ diversifier in a way overvalued sovereign FI is no longer. Oil has upside if one agrees on US shale oil production. Goldman Sachs (GS) forecasts that growth in shale inventory will slow sharply given firm demand from EMs, OPEC’s disciplined production and IMO regulatory action. In addition, oil remains a warrant against the Middle East geopolitical flare-ups, not unlike what we saw happen between the US and Iran last week.
A US airstrike killed Qasem Soleimani, a top Iranian commander, thus explicitly raising the temperature and shifts the scenario from being a proxy war to a direct confrontation. Much now depends on Iran’s threatened retaliation which the US has stated will result in a 2nd round of US attacks on Iranian targets. This, thus, has scope to escalate – the key question is to what degree. We don’t think it is in Iran’s interest to escalate this to a full-on military conflict (as much as it is not in the US’s interest), but it cannot sit back and do nothing. This creates uncertainty and will likely drive oil prices.
We have warned previously that Trump might behave more erratically around impeachment pressures and this deliberate attack follows the same playbook Clinton used. That impeachment process now appears it will be dragged out as opposed to hopes (for markets at least) that there will be a quick Senate trial. This is not good news for certainty and for further risk of erratic behaviour – to the degree the US-China trade deal is not yet signed – to hurt risk-on assets.
As ever we continue to strongly argue that we are in a low return, high volatility set of market conditions – a strategic view that was borne out in ’18 but clearly failed last year – that requires us to be diversified as much as possible and seek uncorrelated alternative income strategies. On the evidence, the USD might ease-off, it may be appropriate to run with less USD-hedged allocations too. Capital market assumptions forecasts for the next five years suggest higher quality FI could deliver zero returns (with capital losses offset by coupons) while equities offer 5-6% with the S&P 500 closer to 3% (EM FI and equities offer highest returns but obviously at higher volatilities). These implied returns are not compelling and make capital preservation even more important when returns are low. After equities had a banner yearning ’19, we need to be quick to react to any major correction.
EQUITIES
Global equities were broadly higher following Trump’s sign off on a ‘Phase One’ trade deal with China, notably so in the US where markets dismissed impeachment news as all three major indices pushed deeper into the all-time high territory. The S&P 500 gained +2.86% in December, taking ‘19’s total return to an impressive +31.48%. Likewise, the Dow and Nasdaq gained +1.74% and +3.54% respectively this month, with the latter outperforming the year with a +36.74% total return as tech stocks led the advance (Figure 2).

Fig 2: US equity indices total returns. Source: Bloomberg
The S&P 500 saw a broad-based gain this month, with all sectors seeing a positive close. Gains were led by Energy and IT stocks, though interestingly the two were the worst and best-performing sectors this year at +48.04% and +7.64% respectively (Figure 3).
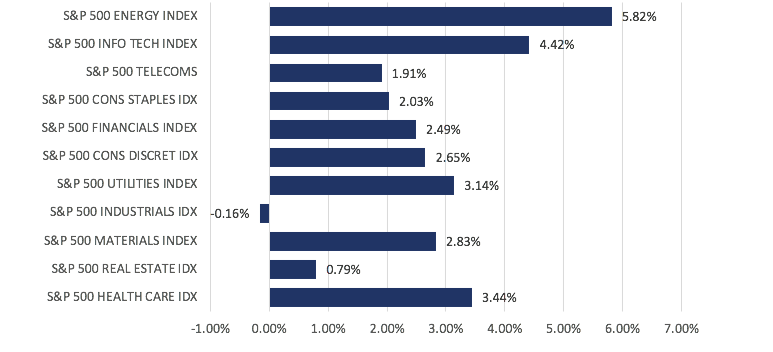
Fig 3: S&P 500 sector returns in Dec. Source: Bloomberg
Markets in the US were also supported by generally positive data prints, with Q3 GDP matching expectations at 2.1%, while core PCE gained 2.1% QoQ for the same quarter. University of Michigan’s consumer sentiment index also had a slight beat, coming in at 99.3 (vs est. 99.2). November’s Non-farm payroll print came in surprisingly strong at +266k (vs est. +183k), even if one were to subtract the 48k GM workers that returned from strike. Unemployment fell to a 50Y low of 3.5%, while wage growth stood at +3.1% (vs est. 3%). The only weak spot came in US retail sales, which gained only +0.2% MoM (vs est. +0.5%), although October’s reading was revised up to +0.4% from the previously reported +0.3%.
Over in Europe, the ECB left rates unchanged as expected, re-affirming commitments to its bond-buying program and low rates until the region can get closer to its inflation goal. Overall, conditions were generally helpful, allowing the Stoxx 600 index to gain 2.06% for the month, taking the full-year gain to +25.26%. Unlike last month, shares in the FTSE 100 outperformed at +2.67% this time around, while DAX lagged behind with a meager +0.10%, after Germany’s manufacturing PMI fell unexpectedly to 43.4 in December (vs est. 44.6) (Figure 4).

Fig 4: European regional indices Dec total returns. Source: Bloomberg
In Asia, equity markets were undoubtedly alleviated by the news over trade, with China understandably one of the top gainers in the region, gaining 6.20%. The HSI also rallied +7.00%, in part off the back of this news, but also as tension on the streets appeared to have tapered off toward the holiday season. Overall, the MSCI Asia ex-Japan (AXJ) gained 6.42%, while Japan and the Sensex lagged the broader region at +1.56% and +1.16% MoM respectively.
There were some encouraging numbers out of China that showed stabilization and a pickup in growth momentum. We also saw China unveil more pro-growth measures, with financial institutions now required to price floating-rate loans on the back of the revamped LPR as of 1st Jan, which will lower costs for c. CNY 152tn worth of outstanding loans in the market. The revised securities law also simplifies the process for corporate bond issuance and raised the penalty for issuance fraud to CNY 20m from CNY 600k, which will take effect on the 1st March.
FIXED INCOME
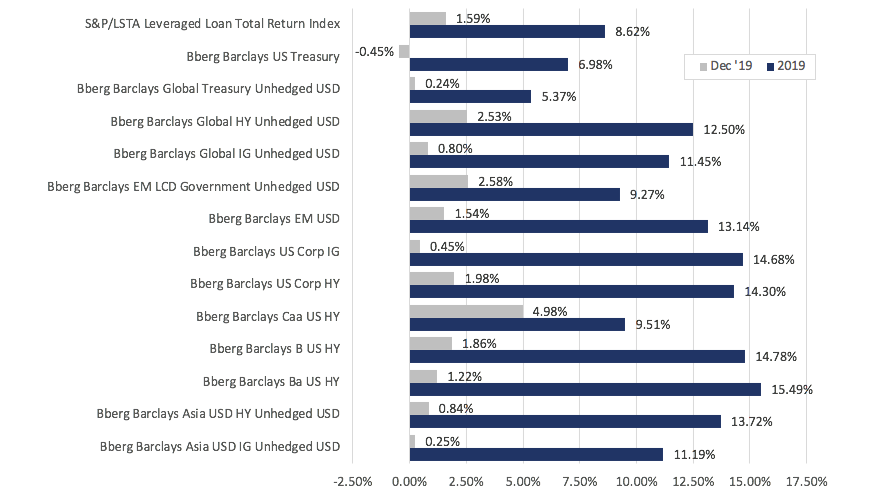
Fig 5: FI sector returns in Dec and in 2019. Source: Bloomberg
The fixed income market was positive in Dec (Figure 5), leading various sectors to see multi-year high YoY returns. Global investment grade (IG) and HY saw their best YoY performance since ’09 and ’16 respectively, while US Treasuries (UST), the only sector to fall in Dec, saw its best YoY returns since ’11.
Global IG spreads narrowed in the last few days of ’19, ending the year at 94bps – 59bps tighter YoY while global HY spreads narrowed 127bps to 419bps. Credit spreads ended the year near/at ’19 lows (Figure 6) as central banks around the world adopted, in one way or another, monetary easing policies. Apparent progress in US-China trade negotiations and more geopolitical certainty also contributed to the risk-on sentiment, thus supporting HY debt.
Moving forward, the tight spreads are attracting primary issuance of c. $120bn in Jan after pausing for much of Dec. HY could also see a busy month as companies look to refinance debt, with c. $9.5bn worth of HY bonds scheduled to mature or be called this month.
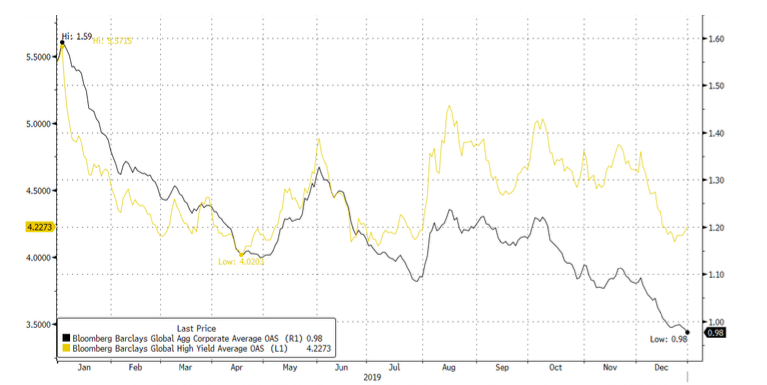
Fig 6: Corporate credit spreads in 2019. Source: Bloomberg
Within HY, CCC debt ended the month as the best performing sector within FI. With spreads rising above 10% for the first time since ’16 after being sold off earlier in the year, coupled with improving market risk sentiment, yield-hungry investors jumped at the chance after hiding out in the BB space for much of ’19. Energy led gains in the sector with oil prices rising for most of the month (Figure 7).
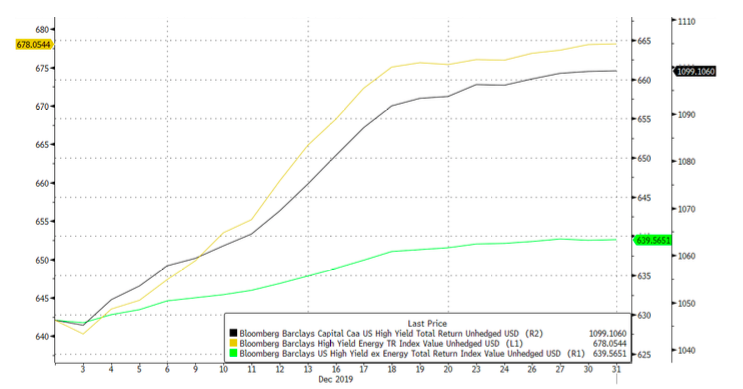
Fig 7: Returns of HY Energy debts vs CCC and HY ex-energy. Source: Bloomberg
This hunt for yield also saw spreads between IG and HY narrow. In particular, ICE BofAML data showed BB/BBB spreads to be at its lowest since pre-GFC (Figure 8), suggesting how overvalued the BB space has become. This trend is likely the reason why Wall Street analysts are forecasting gains of only 1% – 7.5% for US HY in ’20.
However, not all analysts share this view – Blackrock raised its rating for global HY to overweight, arguing that the sector will be supported by stable monetary policy worldwide, and the potential for an inflection in growth.
Blackrock also simultaneously downgraded global IG citing rich valuations, especially with negative rates in Europe and Japan.
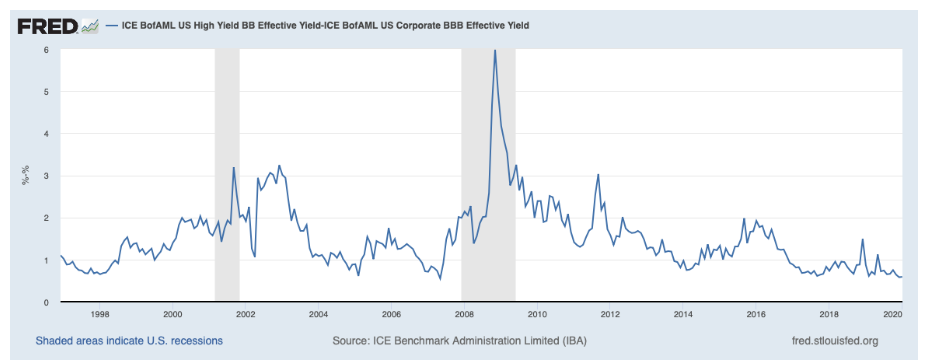
Fig 8: BBB/BB spreads. Source: Bloomberg
Blackrock also upgraded EM local currency debt (LCD) to a “high conviction overweight” noting the attractive coupons and the potential for currency appreciation as USD sees a potentially trying year in ’20. EM LCD saw a strong Dec as USD weakened.
Within EM, we continue to see value in AXJ FI, particularly in the HY space. Apart from a potential reflation in the Asian economies, the sector is likely also supported by technicals. Many HY issuers advanced their refinancing to ’19 and hence these volumes are unlikely to be sustained in ’20, providing support for prices. While China saw another record year of onshore corporate defaults, we see little reason for concern. A number of defaults are a result of idiosyncratic reasons and are not representative of the entire market. Besides, the amount of onshore defaults (c. CNY 130bn in the last few weeks of ’19) is small relative to the entire market.
Finally, we see an additional source of risk in European companies. Moody’s expect companies in Europe to face more rating cuts and higher odds of default this year. It expects defaults to almost triple as more HY companies struggle with weak demand. Moody’s also forecasts the rate of missed payments in the region to catch up with the USA.
FX
USD was by far one of the worst-performing currencies in Dec, weakening against all of its G10 peers and most of the EM currencies. DXY fell 1.92% over the month, falling below 97 for the first time since July ’19 while the JPM EMCI gained 2.66%, its best month since Jan ’19. FX movements continue to be driven by geopolitical events like Brexit and US-China trade over the month. The dollar recovered slightly on the back of positive economic data but failed to sustain the momentum. The weakening sentiment for the USD was reflected in the extended fall in aggregate long USD positioning while GBP positioning turned marginally net positive for the first time in ’19 (Figure 9).

Fig 9: USD and GBP positioning as at 24 Dec ’19. Source: Bloomberg
The Dec weakness for DXY led the index to end ‘19 just 22bps higher while CAD ended the year as the best performer within the G10 group. Asian currencies saw a good year too, with most currencies stronger against the dollar, led by THB. However, tensions and protests in larger European and LatAm EM markets, particularly in Turkey and Chile, weighed on the JPM EMCI, which ended the year -1.36%. Volatility in FX markets also spiked up in the first week of ’20 following US’s assassination of Qasem Soleimani with haven currencies strengthening.
Looking forward, we continue to remain a USD bull until proven otherwise. Despite recent events, USD has proven to be very resilient since the global financial crisis and remains to us the least bad major DM currency fundamentally. However, we are more cautious on USD this year than in the previous five years as US GDP might slow relative to its peers while the S&P 500 looks relatively unattractive. Swaps around fully hedged FI is also not supportive of FIIs buying hedged USTs despite the relative real yield differential positives. If FIIs anticipate a weaker USD, this will boost hedging demand or reduce unhedged buying. Lastly, fiscal reflation looks improbable in the USA this year but more likely to happen in Europe, Japan and ROW – fiscal spending helps strengthen currencies where this happens. In addition, a key catalyst for EUR gains would be signs that Germany is closer to abandoning its overly prudent ‘zero budget’ policy that’s become institutionalized.

Fig 10: FX returns in 2019. Source: Bloomberg
COMMODITIES
The Brent oil price extended its uptrend in Dec after an initial tumble in the first week of the month, resulting in its best year since ’14. Much of the gain here was on the back of an OPEC production cut, with Saudi Arabia committing larger than required cuts. Gold also had its best year since ‘13 and rose to a new 6Y-high at $1,550/Oz as investors, especially in Q4CY19, embraced its merits as a safe haven asset and portfolio diversifier.
Brent oil rallied in the first few days of January following the assassination of Soleimani, but it was surprising that it failed to break above its resistance at $70 until today (08 Jan 2020). This suggests that either markets doubt a severe Iranian response or that oil fundamentals are looking ‘softer’. Oil is still technically in the range of $55-75/brl with low $80s an even bigger resistance. Bears continue to point to an expected surplus of production and building inventories as reasons to be wary of upside from here. However, the fact is Iran probably has the military capability and proximity to close Hormuz Straits through which 40%+ of the world’s sea-bourne oil exports travel.