
For Accredited Investors Only as defined in the Monetary Authority of Singapore Securities and Futures Act (Cap. 289) and its subsidiary legislation. For Professional Investors Only as defined in the Securities and Futures Ordinance (Cap 571, Laws of Hong Kong) and its subsidiary legislation. This advertisement has not been reviewed by the Monetary Authority of Singapore.
A Tale of Two Assets
A major driver of the US equity market in recent months has been continuing decline in the yield of the 10Y UST. This has caught many by surprise, including us. Apparently, there are two forces at play. The first is the positioning of large players in the market that are concerned that if the Fed raises rates earlier rather than later, this will lead to a marked slow-down in economic growth. This positioning by some large players has forced traders who were short the bonds to unwind their trades, causing further downward pressure on yields. The second is the Fed’s own buying of treasury assets, providing an active buyer, exacerbating the downward pressure on yields.
Underwhelming economic data for June and July has fueled the slowdown fears. However, the risk for equity markets is that these two forces diminish or reverse in the next few months. There is an expectation for the Fed to start tapering in the Sep-Nov period and we have previously remarked that bond traders are usually positioned on the “long” side of the trade and a backup in yields can be quite sudden and dramatic as traders are forced to unwind positions. We are not rates experts but the risk reward appears to favour higher 10Y yields by the end of the year. The equity market appears to agree, with the US Bank sector up +6% since August 4, although this is not a particularly strong signal.
What does this mean for equity and credit markets? The credit market is easier. Long duration assets will likely again be hurt as they were in Q1 2021. The equity market is more difficult to fathom. On the positive side, a robust economy should drive top line growth and recovery plays but at the expense of rising costs, i.e. it will depend on the rate of real GDP growth. Should real economic growth exceed expectations, it could be enough to counter any rise in 10Y yields. Therefore, we remain neutral on the equity markets and would continue to avoid or minimize medium and long duration credit assets.
In equity we would maintain our core diversified portfolio and opportunistically add recovery plays as sentiment and economic data stabilizes. We would remain overweight the US, but diversify with some European and Asian stocks. The recent US July non-farm payrolls surprised to the upside with 943,000 and 261,000 people joined the workforce, edging up the participation rate. Further, the USD1tn infrastructure package has passed the senate and is likely to enacted. These should support future economic data. Another positive is the Q2 earnings season which has been strong for all three regions, but where Europe indices have reacted more favorably than the US, probably due to the higher proportion of “Value” stocks as well as higher recovery potential.

Source: JP Morgan
Asia Revisited
Last month we were a hesitant in recommending adding allocation to China equities, citing the difficulty in finding a compelling rationale. However, we did suggest China’s Healthcare and Materials sectors as verdant sectors to find longer-term investments in the volatile China markets. In the last month, MSCI China has fallen -5% and the Healthcare sector has recorded a similar fall, but the Materials sector has risen by +6%, an +11% outperformance.
While there’s no marked change to valuations or earnings outlook, there are some signs of price action stabilization. Bell-weathers Tencent and Alibaba seemed to have found some support at recent levels despite further rumblings about technology regulations. We have also seen sharp upward movements from a variety of stocks in traditional industries – from autos, glass makers, property developers and utilities. Even the much-maligned Zoomlion Heavy has had a +27% pop this month. This suggests there are active value hunters in this market. While we continue to struggle to find a rationale to significantly increase allocation and still prefer a structured method to play this market, those with some stomach for volatility may want to consider a toe-hold into quality names where the price has been beaten down.
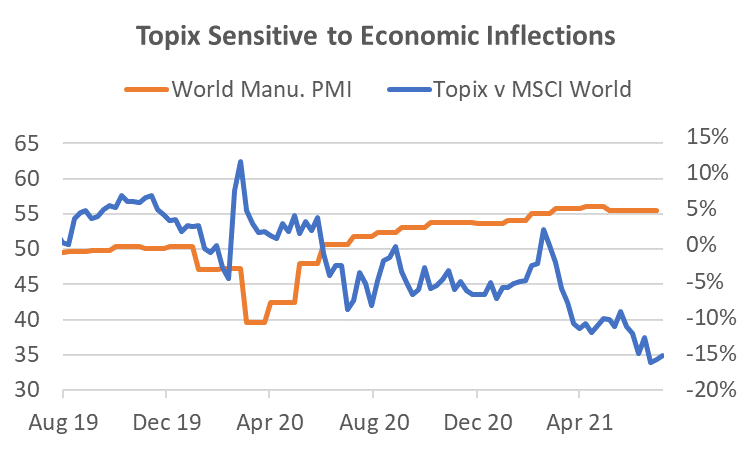
There are few equity markets as sensitive to the global economy as Japan. Although exports to GDP is similar to China at circa 18%, the largest stocks in the Topix are largely export oriented, whereas for China the largest stocks are domestically focused. In times of strong global economic growth, Japan can outperform global equity indices. Since mid-March, near the peak of the economic data, the Topix has underperformed MSCI World by -18%. Should the global economy gain steam in H2 2021, as is expected by many economists, Japan’s indices may well rebound. In addition, Japan’s valuations are cheaper in relation to China in absolute terms as well as relative to its own 10Y median valuation.
Source: Bloomberg
Investment Recommendations
Europe
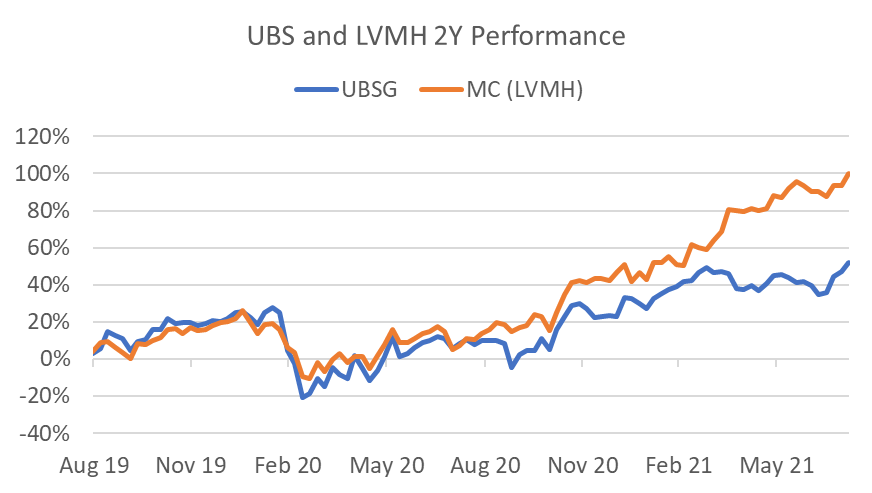
Two industries where European companies have an edge over other regions are wealth management, and luxury goods. Within these sectors, the undeniable leaders are UBS and LVMH. Because of the resilience of their businesses, their management acumen, and higher organic growth, they trade at a deserved premium.
In a world where the rich keep getting richer, UBS is well positioned. It is already the largest Private Bank in the world and the Bank’s focus on UHNW and Asia has seen it continue to outperform expectations. Together with strong abilities in FX and Equities, Q2 2021 Profit before Tax was 28% above consensus. The stock trades at a PER of only 8x 2021 and 0.9x tangible book value.
LVMH’s is the largest luxury goods company in the world and its pricing power is such that it has a policy of never discounting prices on its top brands such as Louis Vuitton. Last year was the first year the company reported negative revenue and EBITDA growth since 2009. Despite the fall in 2020, free cash flow was still EURD8.4bn, the highest on record. In 2021, the company has bounced back with Q2 organic sales growth of 14% above 2019 (not the depressed 2020) and H1 EBIT beat consensus by 15%. The consistently strong cash flow allows the company to cherry pick strong brands as they did with the Tiffany acquisition that was completed in January 2021.
Source: Bloomberg, Odyssey
Japan
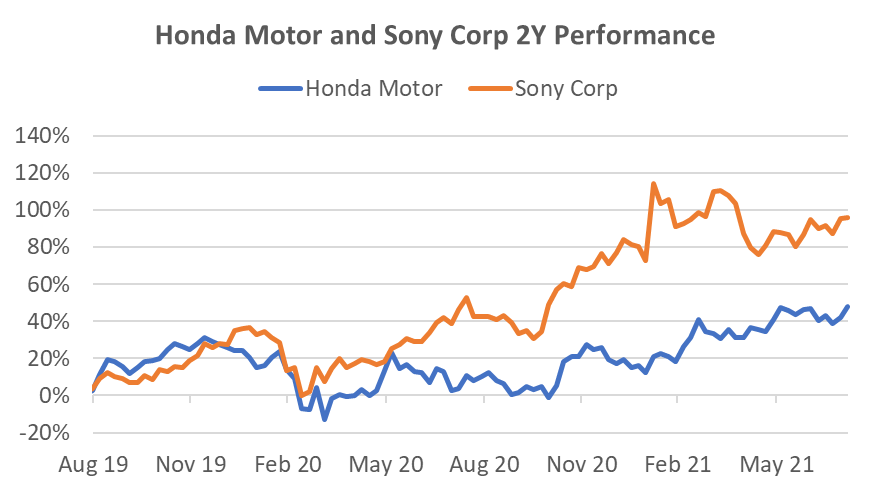
Japanese products remain in high demand for many sectors – gaming, robotics, consumer electronics, and autos to name just a few. Today, I want to touch on two sectors, autos and consumer electronics. Both have performed well but should also thrive with higher global economic growth.
In autos we like Honda Motor. We like the growth of its motorcycle business in Thailand, Vietnam and India but also because its motor car business has been gaining market share. Q1 operating profit released on 3 August was 2.5x consensus and the company raised full year guidance by 18%. This is expected to be achievable through a combination of strong sales and cost control (including lowering incentives in Norther America). The company has also announced a JPY70bn share buy-back scheme totaling circa 1% of approximately outstanding shares. Forward PER is just 8.7x with a 3.6% dividend.
Sony Corp provides exposure to several long-term themes we like such as gaming, entertainment content, semiconductors and electric vehicles. The entertainment giant reported a 15% increase in sales and a 26% rise in OP in Q1 through performances in Games and Network Services, Music, Pictures and Electronics Products and Solutions. In July, Sony announced it had sold 10 million Playstation 5 (PS5) modules. That’s the fastest to 10 million for any of the PS modules and 43% faster than the fastest selling Xbox from Microsoft. Historically, Sony tried to establish its own eco-system and platforms, but the firm has realized in recent years that it is primarily a provider of content and that to maximise profits, that content needs to be efficiently distributed across multiple platforms. For example, it now has distribution agreements with Netflix and Disney+ and has started converted some of its most popular game titles to other platforms.
Source: Bloomberg, Odyssey
Odyssey Model Portfolio Performance


If you like to receive more information on our portfolio solutions, please contact us here: info@odyssey-grp.com.