
January Market View
Equity Market Recovery – Historical Context
The very optimistic November market sentiment carried over to December. Again, all risk assets recorded robust gains, albeit at a lower rate than the previous month. The big question now is whether the strong momentum shown in the last two months can carry over into the New Year.
“Unprecedented” is a word often used about the COVID crisis and certainly most of us have never experienced a similar situation. While it is also an unprecedented situation for the financial markets, broad equity index performances have certainly experienced a similar backdrop. In the last 50 years we have seen a similar rate of recovery from market lows three times – from September 1974, July 1982, and of course from February 2009 during the GFC. It is interesting to note that in these three periods, and indeed for the recovery of all seven previous drawdowns in the last 50 years of greater than 20%, that there appears a significant resistance level after the MSCI World Index approaches 40-50% recovery. Ominously, we are about there now in this recovery.

Source: Bloomberg, Odyssey
As market veterans realise, every situation is slightly different, and this time may end up reacting very different than history. However, markets also do tend to repeat themselves in a broad sense. At the end of the day, none of us have a crystal ball, so we advise investors not to get caught up with the hype and stay disciplined with their risk allocations and investment decisions.
The short-term question is what the January performance will look like and whether that is a harbinger for 2021 performance. While there is plenty of statistical evidence for “Sell in May and Go Away” until November, the evidence for January is less clear cut. In the last 50 years, the proportion of times both January and the full year return was positive is just 54%. You don’t need to run the stats on that to realize the two are not correlated. The proportion of times that January is positive is 64%, again hardly something to get excited about. Compare that to the 78% of years where the month of December is positive.
Why is the Equity Market so Much Higher than pre-COVID?
The simple answer is valuation multiple expansion. Optimists may say that valuation multiples should be high at the bottom of the economic cycle and low at the top. This phenomenon can be seen in many cyclical industries. However, for the market as a whole, there is little empirical evidence for this. The only time we have seen forward PER estimates this high was during the Dotcom boom and that was a speculative rally. Under this scenario, stock prices rise if the gain in EPS is higher than the fall in the EPS multiple. How does the maths stack up when looking at the S&P500 and consensus EPS forecasts? The S&P500 is trading on a next year (2022) forward PE multiple of 19.5x. This is 32% higher than the 13.3x multiple in 2010-2015 period in the years when the market was climbing out of the GFC when we also had zero interest rates. The market is expecting earnings growth to slow in 2022. If we assume this as peak cycle, we would expect the forward PE ratio to fall at least back towards the average of 13.3x, if not below. This means 2022 EPS expectations need to be 42% higher than 2020 level and 22% higher than the very strong 2019 level in order for the market to merely stay flat. This appears a tough ask.
However, should the market believe a higher market multiple is justifiable for longer, then the reliance on EPS growth is lower. This situation may play out should the recovery appear strong in 2021, providing the expectation strong growth will remain for 2022. Periods of high valuations can persist, as they did in the late 1990s, and while they have historically always reverted to mean, the timing is difficult to predict.
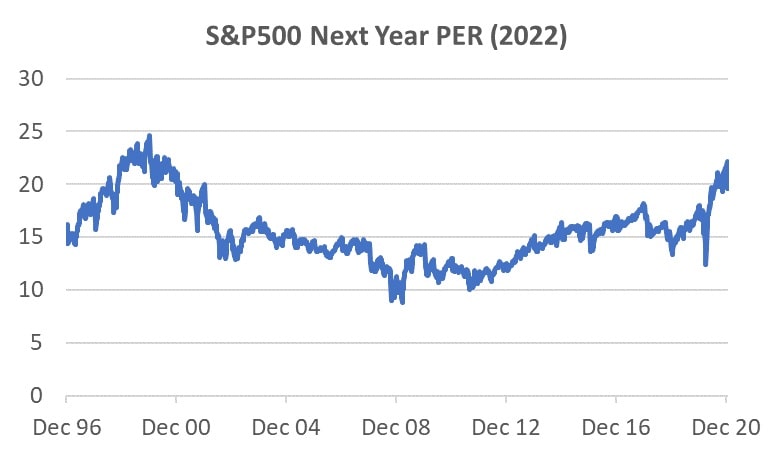
Source: Bloomberg
Diminishing Choices
Since the trough of the equity market in March 2020, the MSCI World Total Return Index has surged by a staggering 70%. However, despite positive inflows in November after the US elections, US equity has experienced fund outflows in a trend that has persisted since 2015. In the liquid space the main beneficiary has been credit and in the illiquid space, while transactions have slowed significantly, the growing popularity of private equity, credit and real estate appears undiminished.
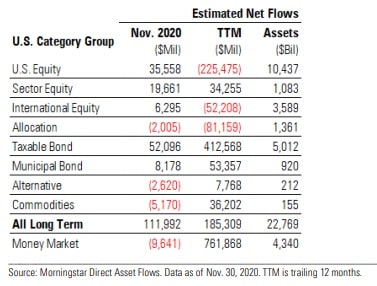
The positive takeaway from this for equity markets is that it appears investors are underweight equity, and its most liquid rival for fund flow, bonds, is providing a historically low yield. The Bloomberg Barclays Global Credit Index is currently yielding 1.4%. It is doubtful many investors, private or institutional, would be satisfied with that return, even for a relatively “safe” asset class.
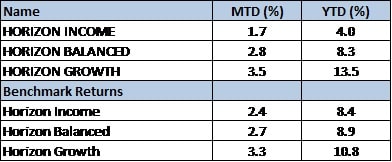
Performances
December Returns
If you like to receive more information on our portfolios solutions, please contact us here: info@odysseycapital-group.com