
For Accredited Investors Only as defined in the Monetary Authority of Singapore Securities and Futures Act (Cap. 289) and its subsidiary legislation. For Professional Investors Only as defined in the Securities and Futures Ordinance (Cap 571, Laws of Hong Kong) and its subsidiary legislation. This advertisement has not been reviewed by the Monetary Authority of Singapore.
Short Term Drivers
The 13th of June marked the start of the Q2 reporting season and the announcement of June US CPI. Fedex’s Q4 reported in late June (May YE) and may augur what to expect – strong revenue recovery but with higher-than-expected cost pressures coming through. This may assist sectors where input costs are less relevant such as Tech. Speaking of Tech, anyone else surprised at the outperformance in recent weeks? The culprit lies in the 10Y UST where the yield has been falling until the last few days. The falling yield occurred in the face of higher-than-expected US CPI readings so the movement was a little baffling. We can only assume that the bond market saw rising inflation as a transitory phenomenon, but we felt the bond market was becoming complacent. Indeed, in the days prior to the June CPI announcement yields on the 5Y and 10Y UST began to back up as the market started to realise that inflation may be higher and stickier than they thought. The 5.4% y-o-y CPI print was higher than the 4.9% consensus and in total the 10Y yield had risen 10bp in 3 days. While this may not be a large move in the scheme of things, I suspect, at least in the short term that we may not be able to rely on UST yields to support the Tech sector and it may even provide a headwind depending on whether the backup in yields has legs.
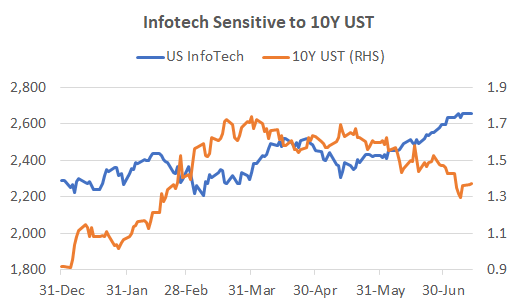
Source: Bloomberg
The Banks have exactly the opposite problem as Tech. Falling interest rates has been the cause of some weakness in Bank shares. They can also be vulnerable to cost pressures, and revenue growth may be more laboured compared to Tech. The only thing these two sectors have in common is that they are both towards the top of historical valuations so they both need to perform to maintain their elevated levels. Early indications from JP Morgan and Goldman Sachs results suggest the market the market has high expectations as share prices were soft following strong top and bottom-line beats for both banks. Investors are becoming more critical as cost pressures rise and easy trading gains have diminished.
While we are in the transitory inflation camp, the strength and duration of this bout of inflation may be higher and longer than the market expects. The consensus view has been that chain supply shortages will ameliorate as global businesses recover with less interruptions, and labour shortages will also dissipate once the COVID benefits cease in Q3 2021. This assumes there has been no structural change in either of these facets, but these assumptions may not be entirely correct, given the severe interruption to both global businesses and the labour market.
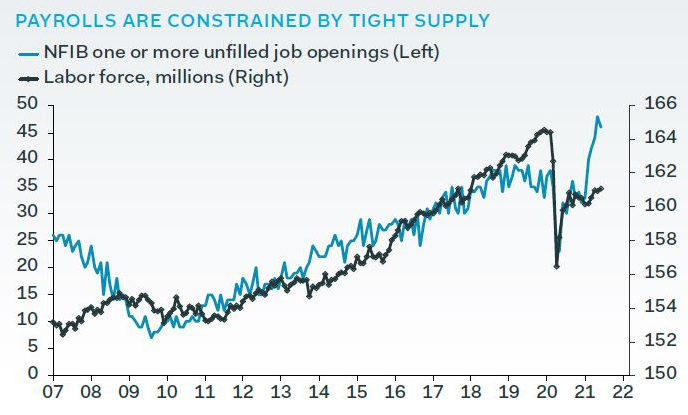
Source: Pantheon Macroeconomics
What About Asia?
It has been profitable to be long the US equity market with the S&P500 up +16% YTD, however, MSCI Europe is not far behind with a 14% rise. Asia ex-Japan has been the black sheep, up just +4%, and only +3% including Japan in USD terms. While Europe’s economy has faced difficulties in its recovery, investor’s switch to Value sectors in 2021 such as Financials and Industrials that comprise 30% of the Index has been of great assistance. These sectors only comprise 19% for the S&P500. Given that the consensus is for a strong global recovery in H2 2021, supported by climbing vaccination rates, Europe may continue to perform.
That leaves the question of Asia. While China was the first economy to recover from COVID and Japan was a major beneficiary of the early optimism for recovery in world trade, both have since languished.
A primary reason for the performance of Asia ex-Japan has been China. No matter which index you look at, the performance has been poor – from the +2% performance of the CSI300 to the -6% of the HSCEI that is heavily influenced by offshore investors. Even MSCI China is down -3%. At least the MSCI China Index is 17% above the pre-COVID high and the CSI300 is 22% above, but the HSCEI is -11% below that level.
.
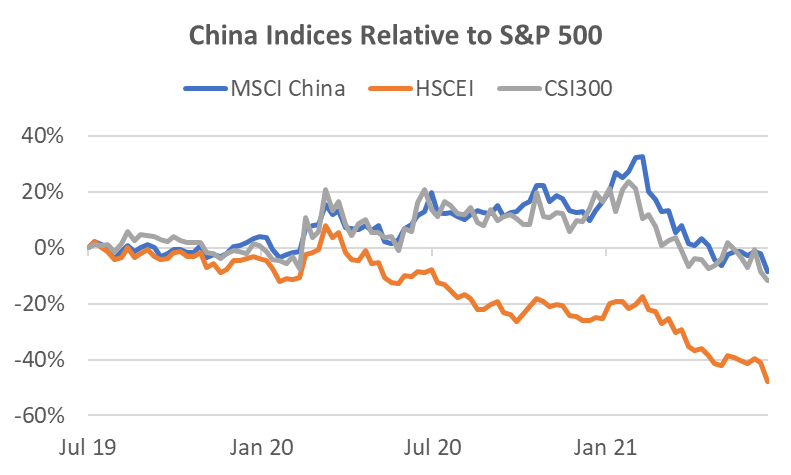
Source: Bloomberg
There are several reasons for the performance. On the macro side, China is constrained in stimulating its economy due to the already high credit to GDP figure that has more than doubled to 290% since 2008. The figure had largely stabilised at 260% between 2016-2019, but shot up again in response to government stimulation since COVID. With the moderation in fiscal stimulus in 2021, growth has also moderated. However, on July 7th, the China government announced it will lower the reserve ratio (RRR) held by banks from the current 12.5% to stimulate further lending. Recent data must be causing the government some concern. This will be the first decline in the RRR since March 2020 and will continue the decline of the RRR since its peak in 2011 of 21.5%. Response from the market since the announcement so far has been muted, but historically China investors have been sensitive to inflections in liquidity. Should there be more concrete signs of a loosening bias, it may result in a rebound in cyclical sectors as well as large cap stocks that have declined significantly.
A major cause of the malaise in China indices has been the double whammy on the two largest sectors in the indices – financials and information technology. For the HSCEI these two sectors account for a massive 63% of the Index. The China banks have been lampooned by investors for having to perform national service in supporting the economic recovery and thus bringing into question the quality of their balance sheets. This also has knock-on effects on their margins and profitability. The second factor, and possibly the more egregious in the eyes of investors is the government clamp-down on what it terms as undesirable practices in the technology sector. In recent memory, technology companies have been the shining light for China equity, but now government regulation has added tremendous uncertainty in this sector. From online shopping to ride hail to online education, it is difficult to discern a concrete policy. Little wonder prices of online technology shares continue to be under pressure.
The good news is that the current policy push will not last forever and the impact on most companies is likely to be minor. Tencent has had many penalties and warnings over the years that has done little to stop its growth momentum. Alibaba’s recent USD2.8bn fine for abusing market dominance hardly makes a dent in its USD73bn hoard of cash. Most importantly, the battle for global technology competitiveness is a major priority for the China government so it has no intention of suppressing innovation, but the booming industry has far outstripped the government’s ability to adequately monitor and regulate, hence we are seeing a rushed piecemeal approach. The bad news is that the lack of policy structure means it is difficult to forecast how long the policy push will last and whether we’ve seen the worst of the news. To add salt to the wound, the Tech sector has been used as a political tool in the battle for economic domination between the US and China, causing greater uncertainty, particularly among the China firms listed in the US.
Is China Cheap?
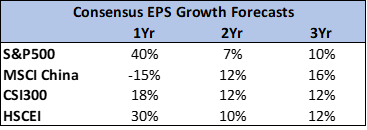
The case is ambiguous. In absolute terms the indices are not cheap, being close to their highest PE ratio level in the last 10 years. Relative to the US you could make the case the China Indices are not far off the largest gap to the US, particularly in the case of the HSCEI. While the situation certainly bears watching, it does not appear yet a compelling story; 1) China indices tend to overshoot on both sides, and 2) earnings growth relative to the US is not currently compelling.
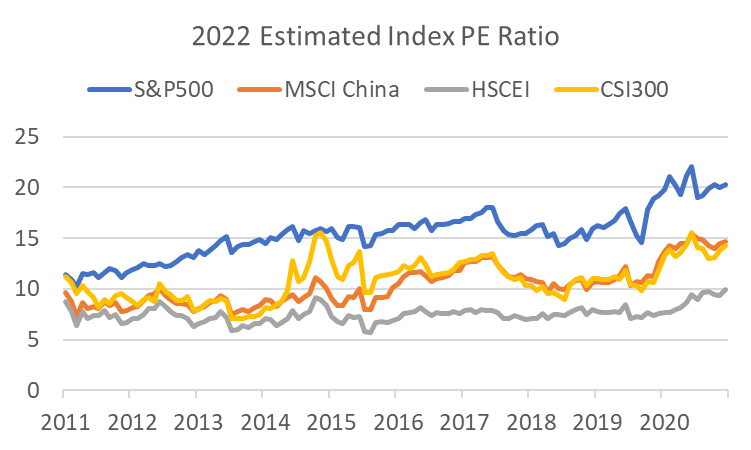
Source: Bloomberg
Source: Bloomberg
Without clear earnings momentum or a valuation argument it is difficult to have a more positive recommendation on China allocation. The only real positive we can point to is the announced fall in the RRR but whether that heralds a real change in sentiment may depend on any further stimulus measures. However, there are sectors that have positive sentiment that we’ll touch on in the following section, and some China bell-weathers do appear to be trading around (and some slightly through) technical support levels. Whether the latter will bounce back is difficult to discern but perhaps a mix of stocks with positive sentiment and mega caps around their support levels may be logical strategy. That said, China stocks are more volatile than those in the US and should be treated as such.
Investment Recommendations
China Sectors with Positive Sentiment

Source: Bloomberg
When investing in China stocks, we look for two primary attributes; 1) a structural tailwind, and 2) positive or at least neutral sentiment. As a proxy to a structural tailwind long-term returns provides an indication, in this case over the last 5 years. The YTD returns provide a proxy for current sentiment. These two filters indicate Healthcare and Materials are potential sectors of interest.
Healthcare
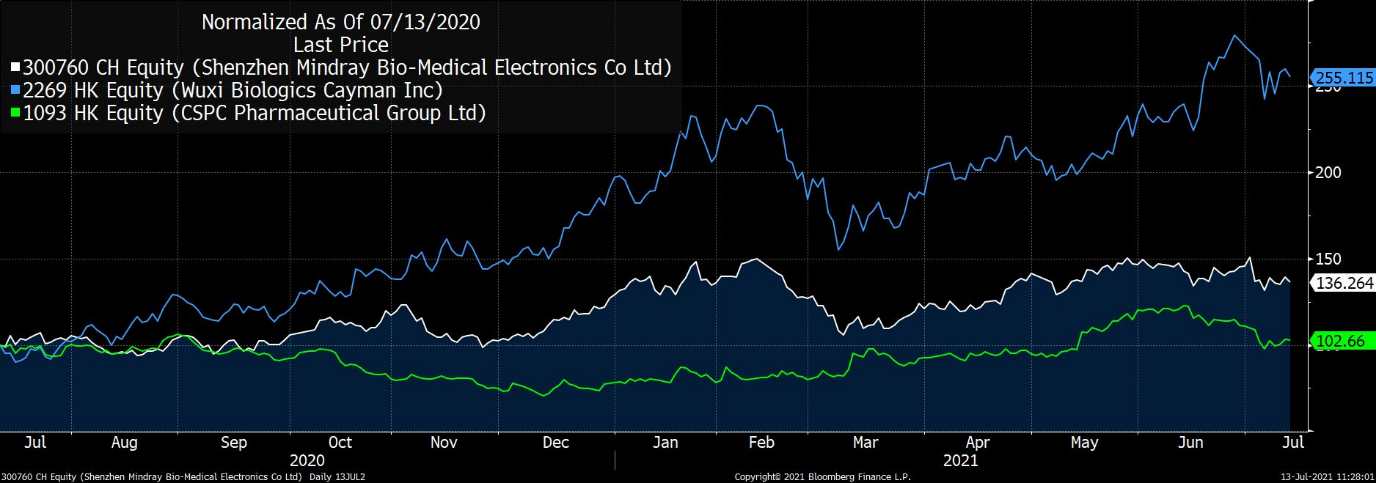
Healthcare is not a sector for value investors. The three largest stocks in this sector have consensus forward PE ratios of 186x for Wuxi Biologics (H), 66x for Shenzhen Mindray (A), and 50x for Jiangsu Hengrui Med (A). Rounding out the top 10 is a stock we’ve previously held in the Model portfolio, CSPC Pharmaceutical, which we bought at a modest 17x valuation, however, all stocks in this sector can be very volatile and can exhibit significant price drawdowns before recovering and exceeding previous highs. Valuations can fluctuate wildly along with the high growth expectations, but because of the structural tailwind the sector has performed well over time.
It’s not coincidental that Wuxi and Mindray are on high valuations. The outsourcing of drug design and manufacturing that benefits Wuxi has resulted in revenue growing by 4.6x in the last 5 years and EBITDA by 6x. Revenue in 2020 grew by 41% and backlog grew by 122% to USD11.3bn. Nevertheless, this robust growth rate appears priced into the shares and perhaps buying on a significant dip may be the way to play this stock. One potential source of risk yet to play a factor is the high US exposure. Should the US-Sino relationship deteriorate to a level that may potentially involve the Wuxi business, this may provide an entry point. North America and China comprise the largest customer base and both account for at 44% of revenue each, not to mention also having three manufacturing facilities in the US.
Mindray is also in an area that has a structural tailwind – global medical equipment manufacture and distribution, specifically equipment involved with life information and support, diagnosis, and imaging. It is the largest medical device company in China and one of the top 50 globally. The company is expecting 20+% growth for the top and bottom-line in 2021 despite already delivering close to 30% growth in both in 2020. Management explained that only 5 out of 25 core products benefitted from COVID-related demand in 2020 while 20 the remaining products were dragged by the pandemic and are recovering. In 2021, 53% of the revenue came from China with only 8% from the US. While valuations remain high relative to other sectors, within the medical device sub-sector the valuation does not appear misplaced. Even in the US medical device companies often trade at double the market multiple due to the favourable industry growth dynamics. Further, medical devices would be less vulnerable to government regulation than drugs.
Source: Bloomberg
What about the CSPC Pharmaceutical Group (H)? This is closer to being a traditional pharmaceutical company. Top and bottom-line growth has not dipped since 2011 when the firm suffered for being more a generic vitamin and antibiotics company. It has since transformed via acquisitions into a more sophisticated and innovative drug company in cardiovascular diseases and oncology with a strong pipeline of products. Interestingly, the stock has fallen 15% since its recent high 4 weeks ago due to pressure by the Chinese government to ensure new oncology drugs are innovative. The increasing scrutiny hit all drug related stocks and CSPC was by no means the worst affected. At 18x 2021 earnings, it would be one of the cheaper pharmaceutical stocks in the sector with a respectable future growth profile. For Q1 2021 revenue grew 10% and net profit grew 27% y-o-y.
Materials
This sector has a mix of exposures, both domestic and global. The moderation in China’s economy has meant that companies that have exposure to the economy and with products that are priced locally such as cement have not fared well. Whether the recent cut in the RRR will help to stimulate the cement price or volume is yet to be seen, but given the recent 30-50% declines in the share price of large cement producers, it certainly bears watching. However, companies that have internationally priced products such as copper and aluminium as well as those with structural demand in providing materials for electric vehicle (EV) batteries have performed well.
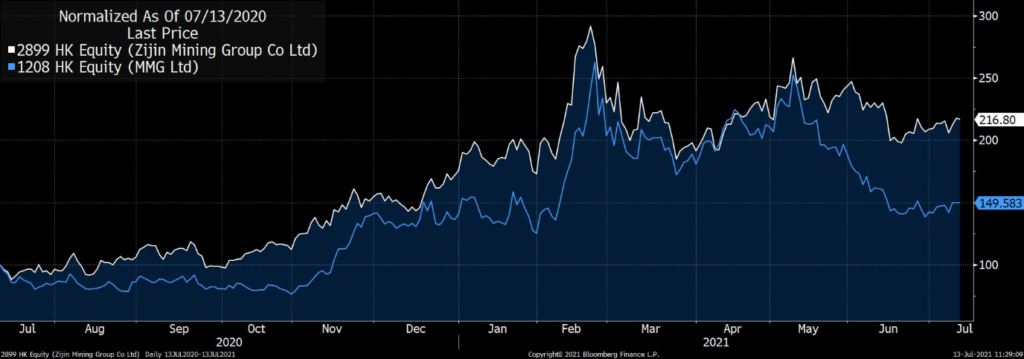
Given the consensus positive view on the global economy for H2 2021 as well as the recent indication that China appears to be trying to re-stimulate its economy, copper exposures are of interest. Zijin Mining Group (H) is the largest component of the Materials Index at 10% and is particularly interesting because while the largest profit contributor in 2020 was copper (and growing), the second largest profit generator was gold which may also provide an inflation play. While Zijin provides an interesting diversification play, it is not the cheapest copper play or the most sensitive to the copper price. JP Morgan calculates that Zijin’s earnings increase about 6% for every 5% move in the copper price. For investors wanting greater sensitivity, JPM advocates MMG (1208.HK) that has 83% exposure to copper and where 2021 earnings will move about 18% for every 5% copper price move and is on 7x 2021 EV/EBITDA relative to Zijin’s 15x, although both stocks are rated “Overweight”. MMG’s market cap is one tenth the size of Zijin’s USD40bn.
Source: Bloomberg
Tencent and Alibaba
Tencent has fallen -27% from its January peak and Alibaba (9988.HK) has fallen -33% from its October 2020 peak. Prospective consensus PE at 22x is the lowest BABA has traded since the stock listed in 2014. While the sentiment is slightly better for Tencent, it is also trading close to the bottom of its valuation range of 28-40x prospective PER at 31x. While valuations appear interesting of themselves, there are also structured methods to play this exposure.
One method is via a fixed coupon note (FCN) containing Tencent and 9988. This instrument will pay the investor a high coupon for the period with the risk that if at the end of the period the price of either share is below the strike, say 15% below the current price, the investor will receive shares at the end of that period in the worst performing share at the strike price. Essentially the investor is willing to accept the coupon in exchange for the potential that the note will be swapped into the shares of the worst performing stock of the two stocks at the strike price. If the price of both shares is above the strike price at the end of the period, the investor simply collects the coupon and the capital is returned, i.e. the investor does not receive any shares. Pricing is subject to change but currently, you can receive a note as per below.

Source: Vontobel, Odyssey
The presence of a KO Barrier means that if at any time after the first month the share price of both stocks is above the original price, the note can be called by the bank and you will receive whatever coupon has accrued prior to the call. Having the call increases the coupon, but it can be removed for a lower coupon.
Of course, there are many iterations – whether you just want exposure to 1 stock, a different strike price or a different tenor. If you are interested in such a pay-off profile, please enquire with your advisor. Investors should be aware that you can lose capital investing in an FCN and should be fully aware of the risks before proceeding.
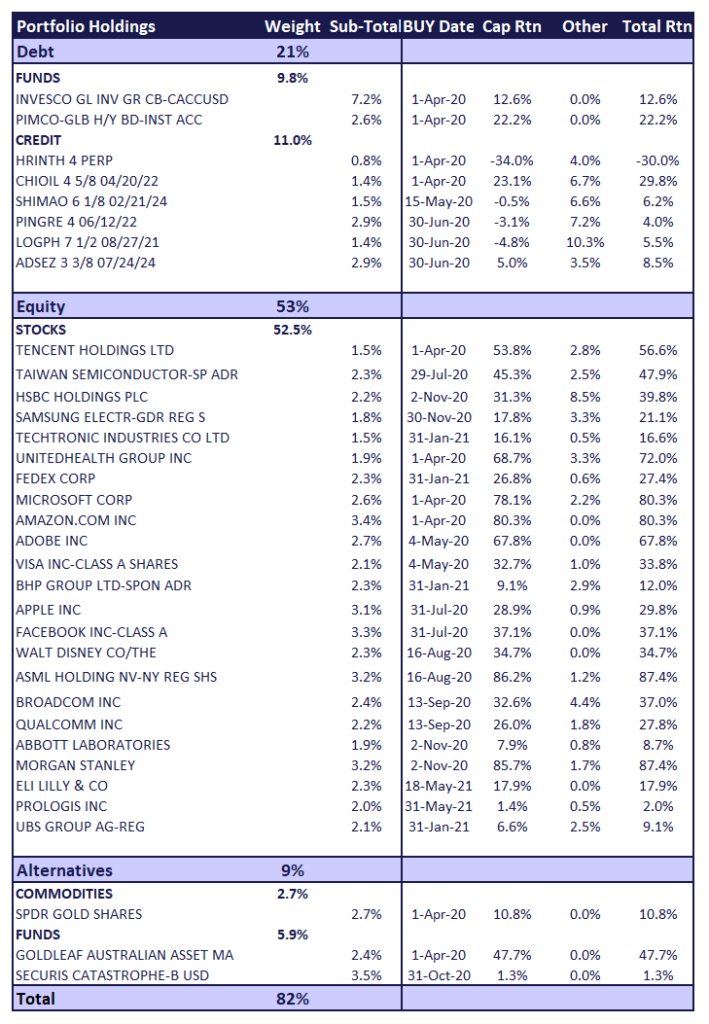
Odyssey Model Portfolio Performance
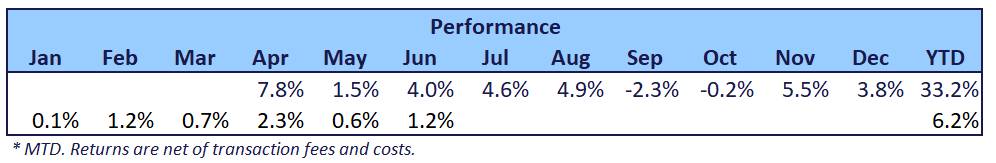
Please note there was a technical issue in May that produced an inaccurate return for that month in the previous monthly update.
If you like to receive more information on our portfolio solutions, please contact us here: info@odyssey-grp.com.