
March 2021 Insight
Inflation is a Dirty Word
If there was one factor that could knock the rally in risk assets on its head is the specter of inflation. That would remove the easy money that has been fueling markets. Right now, it is just the speculation of inflation as indicated by moves in the 5Y treasuries and beyond. Certainly, we have seen some positive inflation in recent data, and that’s a good thing. If we didn’t, it would mean the global economy was not recovering and the markets would have something far worse to contemplate. Indeed, if the recovery accelerates with the distribution of vaccines, headline inflation (CPI) may well surpass the often quoted 2% target in the next couple of quarters term due to low comparisons in Q2 2020 when US CPI fell close to zero. Further, the World Commodity Index has surged 63% since April 2020, which represents large rises in energy and raw material prices.
While headline inflation may cause concern for markets, most governments base monetary policy on some form of core inflation that often excludes food and energy prices. The US Fed favours the Core Personal Consumption Expenditure (PCE) Index as one its measures and this has not been above 2.5% since 1993. Indeed, there has been a falling trend in the PCE over the last 50 years and this unsurprisingly has coincided with the fall in unit labor costs per real GDP. The only time it has sustained above 2% for any length of time in the last 25 years was during the credit bubble of 2004-2008 when it was continually just above 2%. What has been driving this disinflation? My own opinion is that the root cause is accelerating technology adoption and diminishing wage growth due to an ageing working population. In 1999, workers of age 55+ were just 12.7% of the workforce. By 2019 this had almost doubled to 23.4% and by 2029 the U.S. Bureau of Labor Statistics forecast this age group to comprise 25.2% of the workforce.
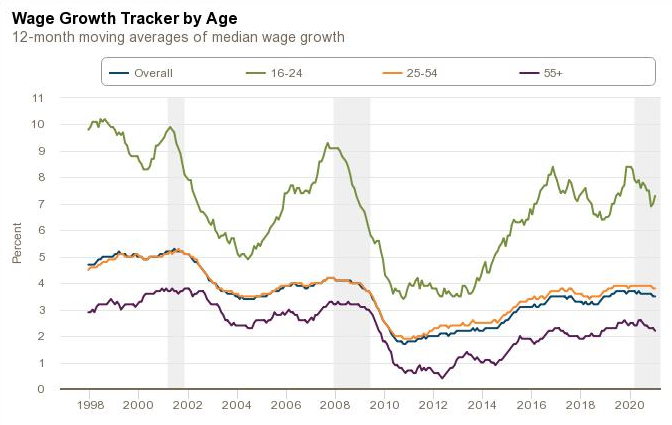
Source: Federal Reserve Bank of Atlanta
Since I am expecting these root forces to continue, it is not expected that the PCE Index to sustain above 2% for an extended time. From the Fed’s dovish comments, we appear to agree. However, the US yield curve is pricing in a rate hike as early as 2023 which is obviously earlier than the Fed’s expectation. Apart from jaw-boning, there is little the Fed can do to affect pricing several years beyond the target rate. The current 2Y-10Y differential is at 1.45%, above the previous spike of 1.34% in December 2016 and close to a potential resistance at 1.5%. Prior to that we had spikes to 1.76% in June 2015 and 2.61% in December 2013. In terms of absolute level of the 10Y UST, the 1.59% yield is similar to that in 2016 and 2012.
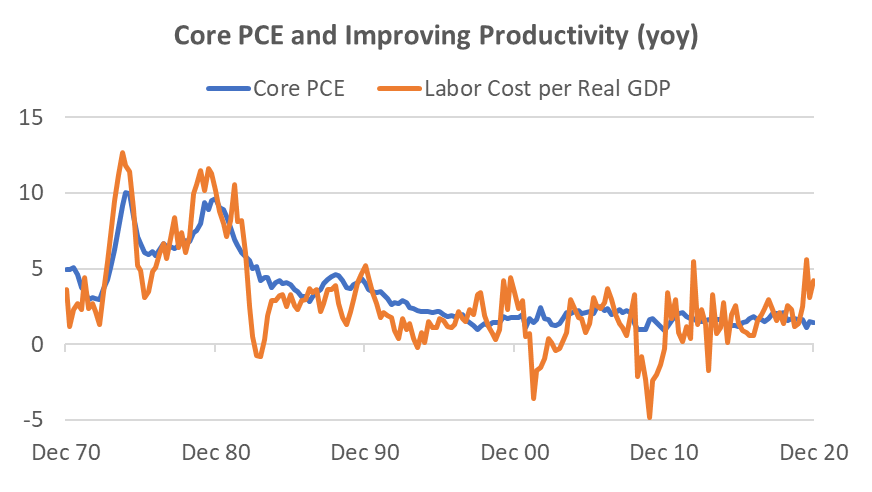
Source: Bloomberg
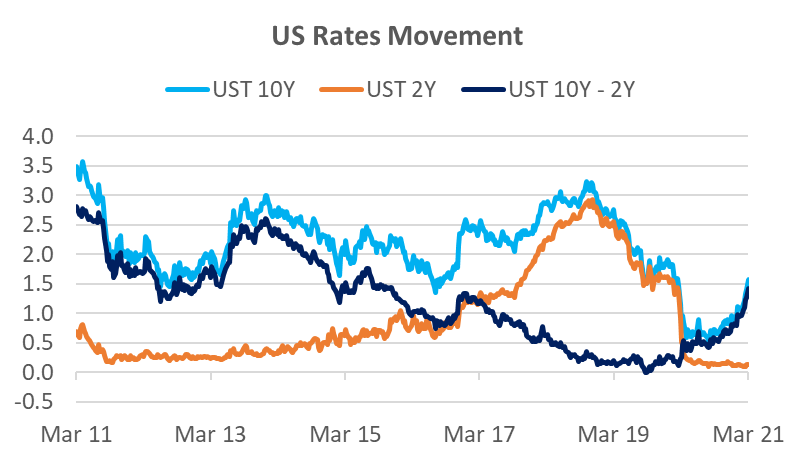
Source: Bloomberg, Odyssey
The Pain Trade in Rates
Several generations of bond traders have made fortunes from being long bonds – making money from when bond yields fall. That is because this has been the trend for three decades. Few traders like to short bonds, because they are betting against the trend. In addition to the specter of inflation, rising bond yields can have significant momentum for a time; everyone is betting in one direction and with significant leverage (often 10x or more). As the bond yields rise and prices fall, it becomes a pain trade for bond traders, and it ends up being a scramble to close out their long positions. The other marginal large player in rates are the large CTA (commodity trading advisors) funds that are followers of directional trends. Commentary suggest they close out their long bond positions in January and started to build up short positions in February. Trend algorithms do not have a human trader’s reticence or care about fundamentals.
Usually when bond yields rise, bond traders have an inkling that either inflation is rising faster than expected or that the government is about to alter monetary policy. In this case, we have only glimpsed the barest evidence of inflation and the Fed has been steadfast in its monetary policy. This is a reason why the bond market and equity investors have been caught a little off-guard, and probably why yields have been higher than what might be expected from fundamentals. Are yields heading even higher? Since the answer appears more technical rather than fundamental, then the short answer is that it is certainly possible.
Dealing with Adjustment Pains
It is not helpful when a market commentator says that the current clearing out in stocks is good for medium and long-term returns when you are losing money. The good news is that blue-chip stocks have been highly resilient. The S&P500 is down less than 3% from its peak and major European burses have hardly moved. In fact, US Value stocks continued to climb another 3% since the S&P500 peak and Banks are up +9%. It’s been the high growth and speculative stocks that have suffered. The Nasdaq has fallen 10% and MSCI China has fallen 16%. Speculative ETFs have fallen 20-30%. In terms of technicals, it’s worth noting that the Nasdaq has hit it’s 100-day moving average. However, the trend of the UST 10Y is likely to remain a major factor.
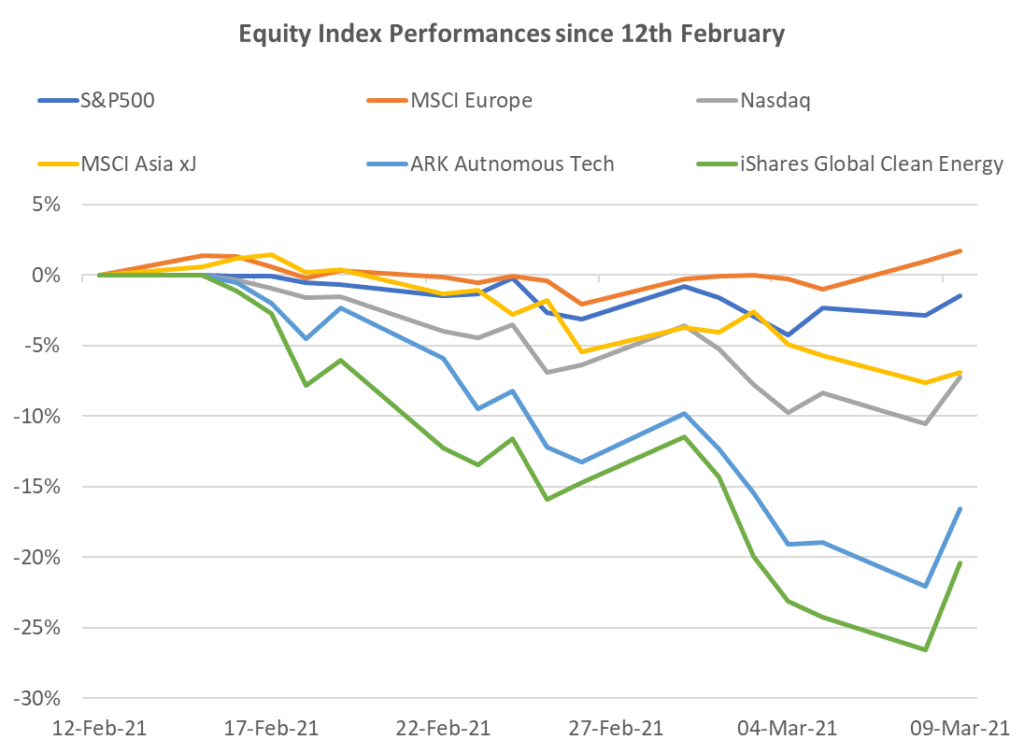
Source: Bloomberg, Odyssey
Mixed Bag in Other Markets
We have been warning about the temptation to buy long duration credit for yield since November last year. The Global Corporate Credit Index is down -4% YTD and US Investment Grade is down -5%. Global HY is largely flat YTD due to lower duration and assisted by a higher carry.
The one asset class that has unequivocally benefitted from the stronger economic outlook has been commodities. The London Metals Index is up +9% YTD, with copper up +14%. WTI Oil is +14% YTD and has moved in virtually a straight line up since the beginning of the year. The main commodity to suffer has been gold which is down -7% YTD and has lost some of its lustre due to the popularity of cryptocurrencies.
Investment Recommendations
When Boring is Good
Back in November 2020 when the Value v Growth issue in stocks first arose, we chose a slightly different tact. We suggested a 3 stock basket that was non-tech and seemed to perform in a steady fashion regardless of whether Value or Growth was favoured. The basket comprised UnitedHealth, Abbott Labs and Morgan Stanley. Since the end of November, the basket is up +14% and up +2% since the recent peak of the SPX500 on February 12. These have not been flashy stocks but together they would have helped to stabilize any equity portfolio and provided significantly better than market returns. All three have announced solid Q4 operational results and we have no qualms about continuing to recommend these stocks, particularly as a basket.
Value in Tech Yet?
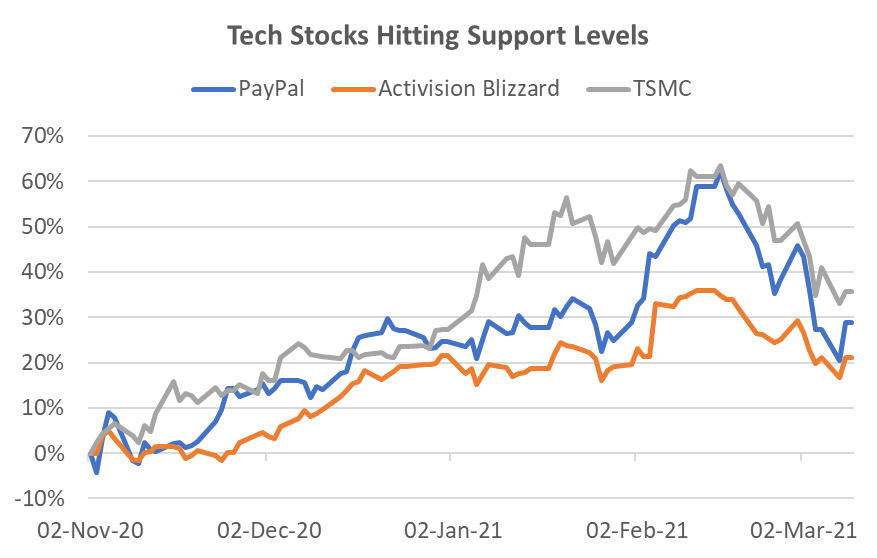
Despite the recent 10% fall in the US Infotech sector, the 1-year forward PER at 30x remains 40% higher than the 10-year average at 21x. Some of this is due to the 41% weight to Apple and Microsoft, but there is no denying the sector remains expensive. Nevertheless, the US Infotech sector has hit the 100-day moving average and if we can get some respite from rising rates, the potential for a technical bounce is possible. There are plenty of stocks that we have previously recommended that had very strong Q4 results but have fallen 20-25% to what appears to be technical support levels. These include Paypal, Activision Blizzard, and TSMC to name just three. However, to find one that is trading close to pre-COVID valuations is more difficult.
Source: Bloomberg, Odyssey
One such stock is Google. We rarely featured this FAANMG last year because its peers were overshadowing its performance, but the last two quarters have seen a marked operational improvement to firmly catch up with its peers. It has been a major beneficiary of the recovery in online advertising spend, but it is not burdened with as many political and sentiment issues as Facebook. In particular, its Youtube business has been riding a wave of popularity, and with a new product suite, the 45% revenue growth in Q4 2020 is expected to remain strong. Further, while Amazon and Microsoft continue to dominate cloud infrastructure, Google Cloud’s large customer acquisition program has started to improve, demonstrated by 46% revenue growth. Finally, Search remained a very solid performer with 17% revenue growth. At a valuation of 29x 2021 earnings, the stock is trading only slightly high to its usual range of 25-30x over the last 5 years. The stock has shown resilience during the growth sell-off and has only fallen 4% from market peak to trough.
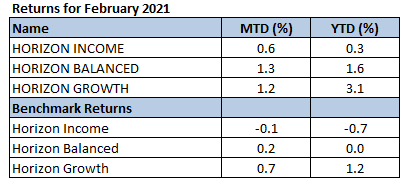
Odyssey Model Portfolio Performance

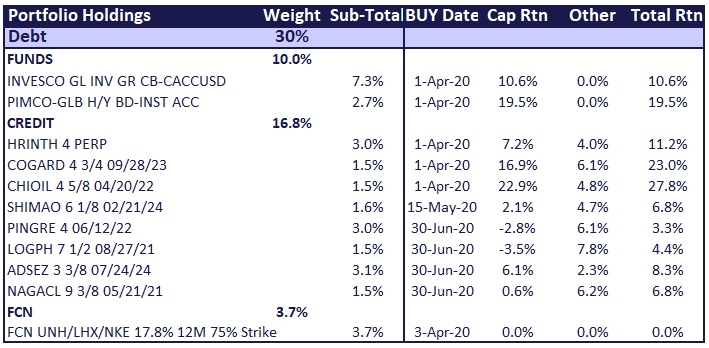
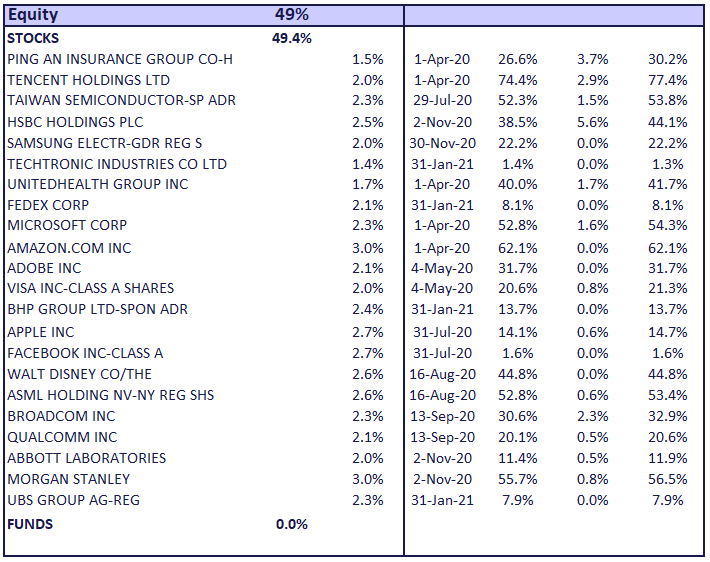
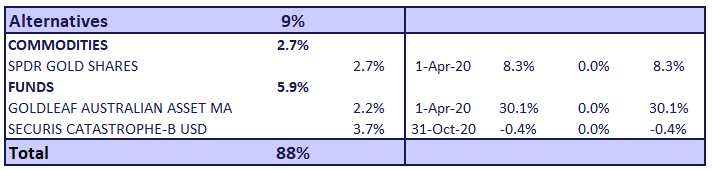
Horizon Performance
If you like to receive more information on our portfolios solutions, please contact us here: info@odyssey-grp.com.