
August was, as expected, a tricky month for risk assets as geopolitical issues continued to sway markets, forcing investors into safe-haven assets amid escalating trade tensions, the Brexit debacle, and a string of weak macroeconomic data releases. Equity markets were red across the board, led lower by Emerging Markets (through the MSCI Em Index) which sold off by more than 5% MoM on global growth concerns as investors de-risked and made a flight to safety. The FTSE 100 also declined by as much, as risks of a ‘no deal’ Brexit grew, while the HSI suffered the most, falling close to 7.4% MoM amidst the ongoing protests. Conversely, US Treasuries rallied with 10Y bond yields falling steeply from 2.014% to close the month just as 1.496% – just under a key 1.5% support albeit recovering above that level in the first few days of September. Gold also climbed as safe-haven assets rallied, but oil swung around US$60/bbl with one downside risk remaining the fast expansion in US shale output seen to rise by another 4.5mm/bpd by YE23.
Markets were not helped either by the surprise contraction in the US’ ISM Manufacturing index, which fell unexpectedly to 49.1, the lowest level since Jan ’16. Whilst consumer data remained relatively solid (in particular, robust household consumption), August did see a steep decline in consumer sentiment with the index falling to its lowest since Oct ’16. On a global scale, we saw contractions in the manufacturing sectors across Europe and Asia, and more markedly so the former, which also saw weak sentiment after Germany’s ZEW index fell to it lowest since December ’11.
On the trade front, we saw a sharp decline of retaliatory moves on both sides, with the most recent round of tariffs imposed by the US notably hitting a significant number of consumer goods. China has been reportedly preparing for their own ‘no deal’ scenario on trade, despite earlier concessions to buy 12mn tons of soybeans from the US this year, and this was not helped by the fact that the US also approved a major arms sale to Taiwan, which some see as a ‘red line’ that may have been crossed.
The Fed’s FOMC meeting minutes also came in less ‘dovish’ than markets had hoped, with broad consensus that July’s 25bps cut was more of an ‘insurance’ one, although views are clearly mixed. Powell indicated at his Jackson Hole speech that the Fed would ‘act appropriately’ to extend the US’ economic expansion, which many took as a sign that the Fed would indeed pander to markets should the need arise. He did, however, allude to a flatter Philips curve, implying that inflation was likely to remain low even if labour markets were to improve. This implied that ‘interest rates will run, on average, significantly closer to their effective lower bound.’
It was a likewise rocky month for currencies, with the decline in USDCNY this month, the worst since ’94, while rising ‘no deal’ Brexit risks weighed on the Pound. A string of weaker macro data releases – notably manufacturing data ‘ was not particularly helpful either. The big question is whether consumer spending stays on course, helping to prop up the economy and thus implying a rebound in global manufacturing. More worryingly is the case where this does not happen, consumption fails, in turn sharply increasing recession fears.
Outlook
Trade continues to deteriorate, but it is starting to look like Trump may need to strike a deal before it starts to compromise his re-election efforts. This suggests that we could see some headway in negotiations sometime in H2CY19. However, data out of China suggests that reflation might be coming through and underpinning the economy, which also makes them an unlikely party that might cede a compromise. It is thus a question of where the Yuan goes, as trade might get worse before it gets better. MS thinks that the >5% fall in CNY is a key move which may help offset US tariffs. They estimate that if all US tariffs are implemented by YE19, it will hit China’s GDP by -80bps which can be offset by a 10% decline in CNY which should boost GDP by c. 30bps. On top, much of the damage would be to US importers, retailers and consumers, and if the US moves to impose 25% on all Chinese imports, we could see a US recession as early as 3Q20 which would be a key period for the US elections.
A reluctant Fed has found itself in a difficult position with the FI markets expecting a rate cut versus what their intentions might instead be. As the Fed dislikes ‘surprising’ markets, Powell will either need to forewarn markets that the Fed is more ‘hawkish’, or give in. Should the Fed choose not to cut rates this month, the risk is that longer duration US Treasuries and IG bonds could selloff hard, as might equities.
In Hong Kong, Carrie Lam has finally caved in by offering to withdraw the controversial Extradition Bill. The question then is whether this is enough to dampen down the violence of the protests, with the danger being that it will not, as the focus grows increasingly more on universal suffrage. This raises the risk that a thus far patient Chinese government will crack down harshly ahead of Oct 1st – a symbolically important date which marks the 70th anniversary of CCP taking power in 1949. In our view, it might be too early to bet on sold down HK equities.
We remain underweight Equities but prefer to stay in high-quality US names with defensive characteristics. Within the US, we still prefer growth stocks (in particular, Tech), although we would avoid social media names that appear to face increasing regulatory risks (i.e. Facebook, Google). We prefer holding cash in USD and have an overweight in Alternatives. We also prefer to keep our underweight in Fixed Income, whilst acknowledging that we have missed rally in US Treasuries so far this year. We prefer to remain cautious in this area as our view is that yields do not reward the current risk undertaken. Likewise, we have shifted HY holdings to a minimum, as a severe risk-off event could derail this space and our view is that a selloff here if it does happen, could be particularly painful.
Equities
-
Equity markets in the US saw a steep decline earlier in the month, recovering briefly only to be rocked by a combination of weak manufacturing data and the continued escalation of Sino-US trade tensions. The S&P 500 traded mostly rangebound between 2,940 and 2,830, closing -1.81% lower for the month. The Dow was down -1.72% MoM, while tech stocks suffered, and the Nasdaq fell -2.60% MoM (Fig 1).

Fig 1: YTD performances of US indices. Source: Bloomberg
-
Within
the S%P 500. Energy shares underperformed on the back of weak oil prices, which fell as a result of lower demand expectations after macro data pointed to a slowing global economy. Similarly, financials also fell significantly as expectations of a rate cut cycle grew. Thus, we saw a rotation into defensives like Utilities, Real Estate, and Consumer Staples which outperformed (Fig 2).
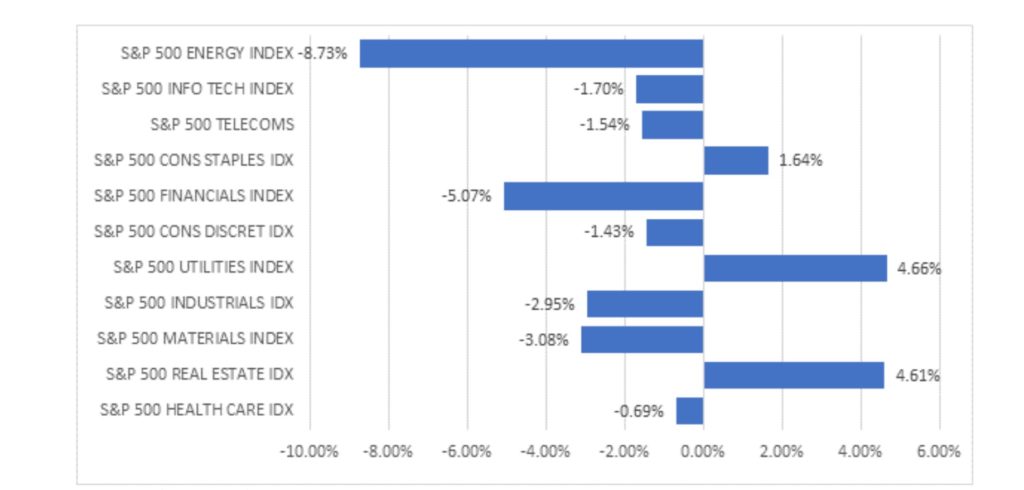
Fig 2: Performace of S&P 500 sectors in August. Source: Bloomberg
-
European stocks also declined, albeit somewhat buoyed by an intended rollout of significant easing measures by the ECB. The Stoxx 600 index was down -1.63% MoM, weight lower by Germany’s DAX index (-2.05% MoM), but more so by the FTSE 100 which declined by 5% MoM (Fig 3). Sector performance in the region was similar to that of their US counterparts, with defensives like Utilities (+3.33% MoM) and Real Estate (+2.76%) outperforming.
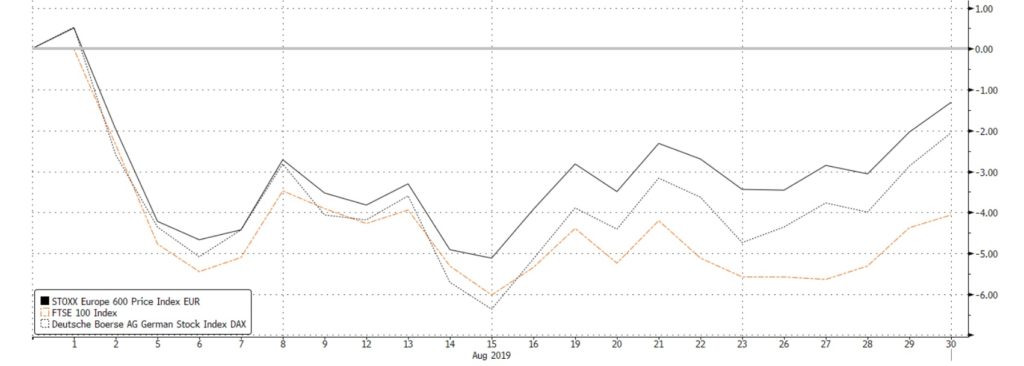 Fig 3: Performance of the SXXP, FTSE 100 and DAX in August. Source: Bloomberg
-
Stocks in Asia were hard hit by several factors, with EM (MSCI ASEAN fell -4.53% MoM) names seeing a steeper decline, especially those which were more vulnerable to a slowdown in global growth/trade. A-shares (-1.56% MoM) stayed relatively resilient, notably outperforming its large index peers despite the ongoing dispute with the US and weaker manufacturing data. The HSI (-7.39% MoM) was understandably the key underperformer in the region, given the unrest on the streets and mounting concerns that China might be growing weary of staying their hand and choose to intervene more sternly (Fig 4).
 Fig 4: Performance of Asian indices in August. Source: Bloomberg
Fixed Income
-
US Treasury yields plummeted amid the flight to safety as trade tensions and concerns over global growth weighed in, with the entire yield curve making a parallel shift downwards. 2Y yields fell by 37bps to close at 1.504%, while the 10Y yields saw an even steeper decline from 2.014% to close the month at 1.496% (Fig 5).
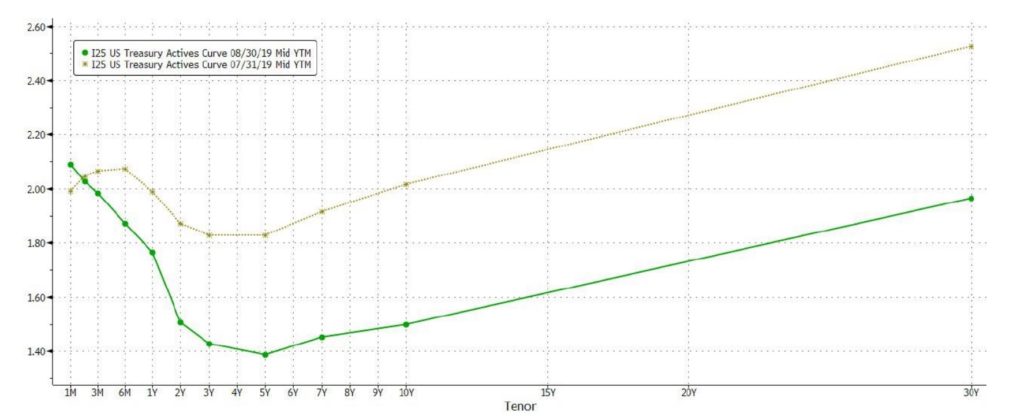 Fig 5: 1M Comparison of US treasury Yield Curve. Source: Bloomberg
-
US Investment Grade bonds outperformed, with the aggregate index gaining 3.14%, followed by Asian USD IG bonds which gained 2.41% for the month. Understandably, EM Local Currency Debt declined by -2.00%, while globally, prices of HY bonds fell by -1.56%. CCC bonds in the US also suffered, losing -1.88%.
-
August saw a number of major banks lowering bond yield forecasts, with the HSBC slashing US10YT estimates to 1.5% at YE19 from an earlier 2.1%, and 10Y Bund yields to -0.8% from an earlier -0.2%. Similar moves were made by JP Morgan and Goldman Sachs, the latter trimming its YE19 forecast for US10YT yields to 1.75% from an earlier 2.80%.
-
September is seasonally one of the busiest months for fixed income, with primary issuance in the IG segment set to be as high as $125b according to a preliminary survey of dealers. Although IG spreads have widened significantly since early August, demand looks to remain strong after we saw a month of record flows into IG bond funds.
FX
-
The FX market continues to be driven by geopolitical events (Fig 6). August saw retaliatory actions taken by both the US and China, signaling yet another escalation between the two nations. Brexit ‘clarity’ continues to drive the Sterling as market participants unwound short positions as parliament lowered chances of a hard Brexit. The EUR rose in tandem with the Sterling, aided by the possibility of ‘QE 2.0’ which was sparked from the steady stream of deteriorating industrial and manufacturing data. These factors caused both the EUR and the Sterling to dip below key support levels of 1.20 for the Sterling and EUR’s 1.10.
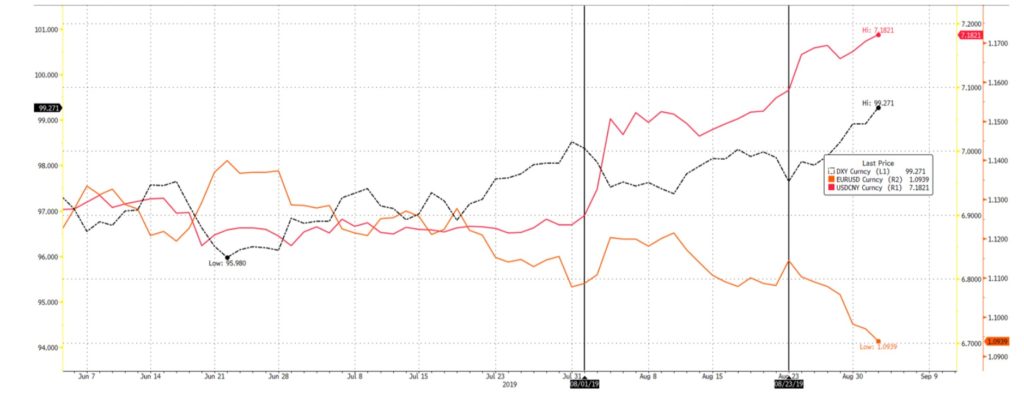 Fig 6: Tariffs are still the main source of activity for FX. New tariffs highlighted by black vertical lines. Source: Bloomberg
-
CNY weakened 4.34% from 6.88 t0 7.18, the EUR fell 1.31% from 1.1070 to 1.0940 after it managed to touch 1.12 and GBP fell 1.50% from 1.2150 to 1.1970 and managed to trade to a monthly high of 1.23 on short squeezes. It is worth noting that 1.20 is a 2.5-year support for the Sterling. This caused the DXY to extend its yearly highs from July to touch 99.130 on the 2nd of September. This G7 volatility is to remain at ‘elevated’ levels relative to the first half of 2019.
-
Positioning wise, GBP is now highly net short with over -100k net contracts, the largest it experienced since 2018, and JPY is now net-long since the beginning of August. We currently see room for GBP to rise further, simply on the fact that 1.20 remains a strong support and provides an opportunity for a short squeeze. With net shorts at a yearly high, the unlikelihood of a no-deal exit increasing along with the help of the EUR (aided by temporary CNY strength), we believe that GBP may reach 1.25. Should tensions continue to ease, we see GBP, AUD, as well as major export-based FX pairs (THB, KRW, and TWD) to continue to gain (Fig 7).
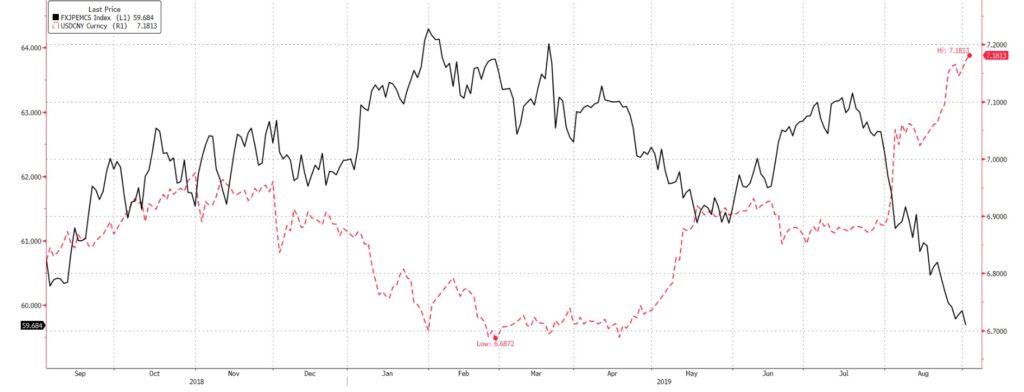 Fig 7: The CNY remains the primary driver of AXJ currencies. Source: Bloomberg
Commodities
-
Brent fell below a key psychological/technical support of $60/bbl as Trump added new tariffs on Aug 1st, adding to fears of a slowdown in global growth. The announcement of tariffs caused the Brent price to dip from $64.10 to $56 and Gold saw a rise from $1413 to $1550 (Sep 4th). China’s retaliatory response on Aug 23rd added even more downside pressure. Brent ended the month slightly lower at $59 and maintained a short-term trading range between $61.30 and $58, after recovering from $56. Gold still maintains a strong upwards momentum as its previous resistance has now become a support (Fig 8).
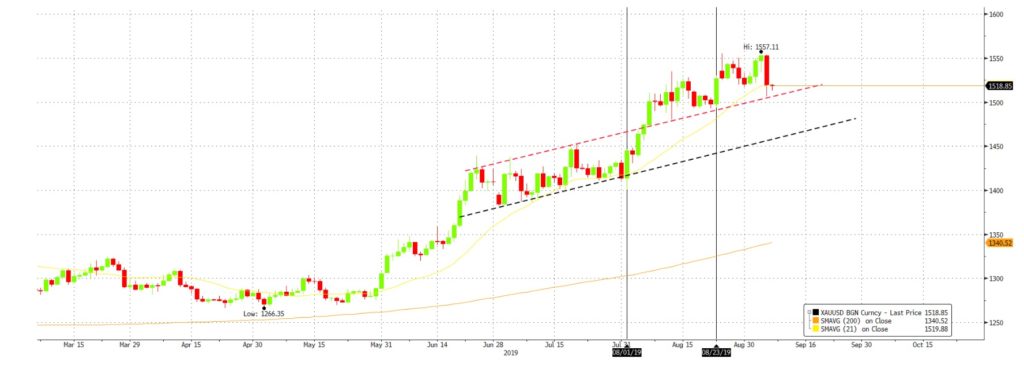 Fig 8: Gold’s momentum is supported by tariffs. Its previous resistance is now a support. Source: Bloomberg
-
The trading range is caused by a few factors; global refinery outages fell to seasonal nine-year lows as they front-loaded 2019 maintenance cycles in preparation for IMO 2020 rules; OPEC’s output rose for the first time since its commitment to dent supply, due to Russia’s 1.2% gain in output (this comes before their re-commitment on the 4th Sept); Hurricane Dorian, the first Cat 5 major hurricane of 2019, which if foreseen to impact the Gulf of Mexico.
-
For September, we see Brent’s $58 to hold as a support and for the 200DMA at $64 to be tested. With freshly added tariffs and further interactions to be had with President Xi and Trump, we believe that this familiar phase of non-aggression should allow other short-term factors to push the price of oil higher in the interim. This includes the return to commitments cut from Russia to cause a further slowdown in OPEC supply, and for Hurricane Dorian to reach the Gulf of Mexico and thus dent production.
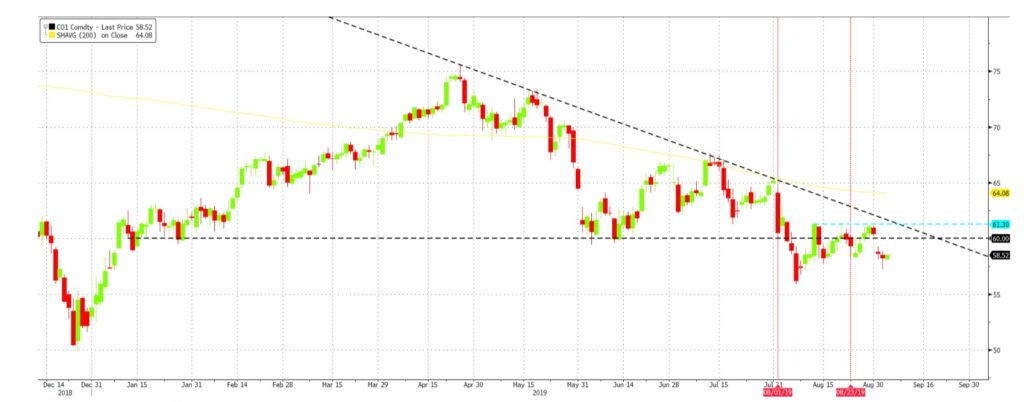 Fig 9: Retaliatory tariffs have pushed oil lower, whilst OPEC supply kept prices buoyant. Source: Bloomberg