
Aug 7, 2020 | Articles, Global Markets Update
Market View
The Big Dilemma
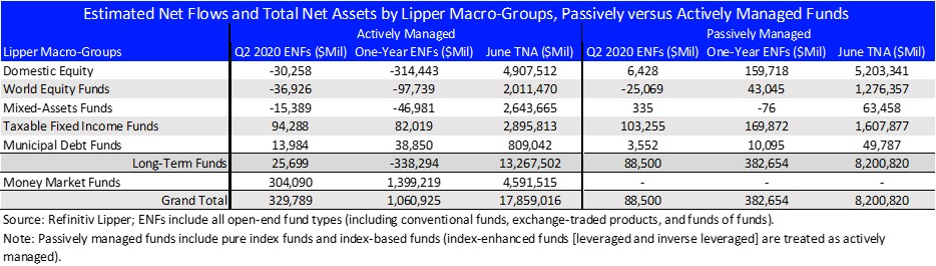
The current Yield to Worst for the Bloomberg Barclays Global Agg Credit Total Return Index, a Global USD Credit Index, is 1.5%. This may seem a low return, however, fund flow data suggests that investors prefer to get a suboptimal low return than experience the uncertainty of the equity market. Even as the MSCI World net return posted a 19% increase in Q2, Lipper data showed USD86bn left Equity Funds while Taxable Fixed Income Funds saw a USD198bn increase. A significant proportion of the latter when to high yield (HY) funds due to the attractive credit spread and yield in April and May.
Multi-asset absolute return portfolio managers now face a difficult decision. At the end of March, Credit was an attractive haven after the COVID sell-off because Global Credit spreads had widened by 120bp and the Yield was a decent 3%. Global HY was even more juicy with spreads widening by 450bp and the yield was 10.5%. The high carry and the potential for capital gains, especially with the US government back-stopping the US credit markets, was irresistible for fixed income veterans, a virtual slam dunk.
However, now with credit spreads, and in particular, yields, approaching pre-COVID levels, the outlook for returns is greatly diminished. The Global Credit Index has returned 7% YTD, and those that focus mostly on that asset class, may well decide that is sufficient for 2020 and rest on their good fortune. For those of us that are still trying to optimize their returns going forward, the return outlook for credit is unappetizing, and we must judiciously look further afield.
The Choices
Many of us are in the same boat. Whether we are a retiree or still working, an endowment, a sovereign wealth fund, or an insurance company, we all have future liabilities that need to be paid for through investments. This means we need to get an adequate return on those investments. The required rate of return will depend on your particular situation, but for most the number will be between 5-10% over the cycle. Let’s pick a round number and say we want a 7% return. If our investable universe is Bonds (Credit), Equity and Alternatives, and our Bond portfolio provide a 3.2% YTM (70:30 mix of investment grade and HY), then Equity and Alternatives combined must make 9% in the next 12 months.
 Source: Odyssey
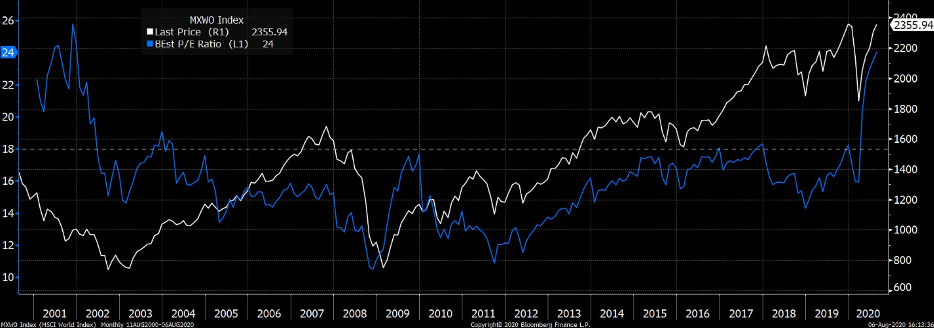
For Equity, if earnings are not adjusted higher than current estimates, it would mean that the 2021 MSCI World Index PER would need to be 19.5x (currently 17.8). Apart from extraordinary circumstances such as COVID and the Dotcom boom, the Equity market has only traded as high as 18x – at the peak of the 2017 and 2019 bull rallies. For those that say we now have zero interest rates, so equity multiples can be higher than previously, I would point out that we’ve just had 7 years of zero interest rates in the US from 2009 to 2015. We are not saying you cannot make 9% return from your equity portfolio over the next 12 months, and we hope you do, but we suspect the equity market needs to have a number of positive developments that are not currently apparent for the broad indices to enjoy that type of return.
S&P500 and Current Year PE Ratio
Source: Bloomberg
Can Alternatives bridge the gap? The HFR Hedge Fund Index (HFRHFI) has return 1.6% YTD, which is marginally better than the broad Equity Indices, however, the 6% total return in the last 5 years hardly inspires confidence. The HF Index has even underperformed the Global Credit Index by 24%.
But what about the illiquid strategies? Despite a significant lag in valuation in many cases, unlisted investments do not appear to have gone unscathed. In March AustralianSuper announced they had marked down their unlisted investments by 7.5%. For Q1, Softbank’s Vision Fund with USD76bn invested, lost USD17bn yoy. Carlyle’s Tactical Private Credit Fund’s NAV fell 18% due to COVID and has since recovered approximately half the loss. Commercial real estate has been a mixed bag. Office and industrial exposures have been largely resilient while traditional retail and hotels have suffered and will likely take some time to recover to pre-COVID levels.
Despite some recent losses, there appears a strategic move on the part of large institutional investors to gain further exposure to unlisted investments. Even AustralianSuper is looking to beef its private equity exposure and Calpers has recently stated it believes it needs to raise its exposure to private equity and credit investments if it’s to reach its 7% per annum return target over the next 10 years.
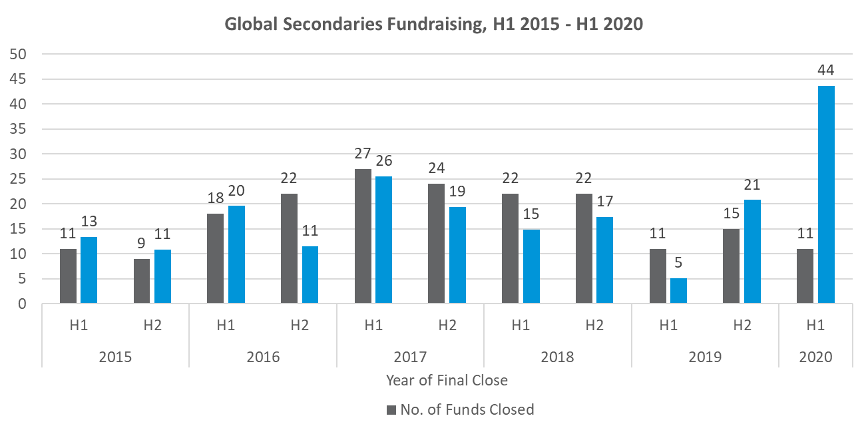
Data tends to support this strategic move by large institutional investors. In H1 2020, private equity experienced USD241bn in fund inflow, USD7bn more than H1 2019[1], despite COVID. While much of the investments were made prior to the COVID lockdown, it indicates the underlying demand. Further, while the number of private secondary transactions declining by 30%, the USD44bn raised in H1 2020 was more than the whole of 2019 (USD26bn)[2], indicating the high demand for secondary transactions.
 Source: Prequin
Conclusion
The current low yield environment means that for investors that are continually trying to create a portfolio that can provide 5-10% returns going forward, more risk needs to be taken beyond the relative safety of the credit markets. Whether that is through the highly liquid but volatile public equity market, or via unlisted vehicles, or a combination of both, depends on the goals of the individual investor. From our experience, most private investors are underweight alternative assets and further investment in this asset class would likely increase diversification, boost long term returns and lower overall portfolio volatility.
[1] Private Equity International
[2] Prequin
If you like to receive more information on our portfolios solutions, please contact us here: info@odysseycapital-group.com
Jul 21, 2020 | Articles, Global Markets Update
Welcome to the June issue of Capital Pulse, Odyssey Corporate Advisory’s quarterly publication that focuses on major capital and financial markets events that occurred during the quarter and its potential implications for you and your business.
Odyssey Corporate Advisory is an independent boutique consultant providing business advisory, investment consultancy, project management and coordination services for companies that intends to access the Hong Kong capital markets.
Secondary listings are likely to remain the flavour of the month, if not the year. So, what are secondary listings and is this a money-making opportunity for investors? Are there any shareholder rights implications for investors owning secondary listed companies in Hong Kong compared to primary or dual-primary listed companies?
HEDGING LISTING POSITIONS
We provided an introductory discussion on secondary listing in the June edition of Lex Capitis. In this month’s Capital Pulse, we delve deeper into this category of listed companies and the renewed interest in this space.
The possible legislation of the Holding Foreign Companies Accountable Act (“HFAA”) and the timely creation of Chapter 19C in the Stock Exchange of Hong Kong (“Exchange”) listing rules (“Listing Rules” ) late last year has revitalised secondary listings in Hong Kong.
The recent listings of Alibaba, Netease and JD.com have raised HK$163.04 billion, and further similar secondary listings are expected. With the exception of these recent secondary listings, such listings have traditionally been far and few.
Typically, companies secondary list in Hong Kong because their business has a major exposure to Asia, but their home stock exchange is not based in Asia. Alternatively, Asian companies obtain a secondary listing in Hong Kong because most of its business are concentrated in Hong Kong and/or China.
However, from an investor point of view, secondary listings do not offer much to investors, unless there is an arbitrage opportunity in the IPO with its already listed shares in an overseas exchange, because investors can purchase those company’s shares in their home stock exchange. The only exception to this case is mainland Chinese investors that rely on the stock-connect arrangements with overseas stock exchanges to purchase international shares.
Since 1999, Hong Kong only had 13 companies that chose to obtain a secondary listing status in Hong Kong because these companies believed their business would benefit tangibly or intangibly from a secondary listing status. However, seven of these companies has delisted predominantly due to low trading volumes of its secondary listed shares. The history of secondary listed companies in Hong Kong since 1999 is presented in Table 1 below.
Given the current geopolitical environment, the HKEX might benefit from the return of large Chinese companies listed in the USA via a secondary listing and, thus, Hong Kong retaining its status as a premier exchange to raise capital in 2020. However, with the unrelenting ravaging impact of Covid-19 on the real economy, one would wonder whether there are any more rabbits left in the hat? Perhaps recent announcement by the CEO of the HKEX not to renew his contract could be telling.
Table 1: Secondary Listings in Hong Kong
|
Stock Code
|
Company Name |
Country |
Nature of Business |
Primary Exchg. |
Listing Date |
Market Cap with IPO price (HKD Billion) |
Delisting date |
Delisting reason |
|
09618
|
JD.com, Inc. |
China |
Information Technology – e-commerce, retail |
New York |
18/6/2020 |
596.5 |
|
|
|
09999
|
NetEase, Inc. |
China |
Information Technology – games and online services |
New York |
11/6/2020 |
421.8 |
|
|
| 09988 |
Alibaba Group Holding Ltd. – SW |
China |
Information Technology – e-commerce, retail, e-payment |
New York |
26/11/2019 |
3764 |
|
|
| 06288 |
Fast Retailing Co., Ltd. – DR |
Japan |
Consumer Goods – Apparel |
Tokyo |
5/3/2014 |
282 |
|
|
| 06813 |
CapitaMalls Asia Ltd |
Singapore |
Properties & Construction – Shopping Malls |
Singapore |
18/10/2011 |
30.265 |
22/7/2014 |
Restructuring into Parent
|
|
06388
|
Tapestry, Inc. – RS ( Formerly Coach Inc.) |
USA |
Consumer Goods – Apparel |
New York |
1/12/2011 |
141.54 |
2/3/2018 |
Low trading volume |
|
00805
|
Glencore plc |
Switzerland |
Materials – Commodities |
London |
25/5/2011 |
3.716 |
31/1/2018 |
Low portion of shares on the HK Register |
|
00847
|
KAZ Minerals PLC |
Kazakhstan |
Materials – Mining |
London |
29/6/2011 |
88.64 |
1/8/2018 |
Low portion of shares on the HK Register |
| 01021 |
Midas Holdings Ltd |
China |
Materials – Alloy Manufacturing |
Singapore |
6/10/2010 |
6.43 |
1/8/2018 |
Insolvent: liquidated
|
| 01878 |
SouthGobi Resources Ltd |
Mongolia |
Energy – Coal Mining |
Toronto |
29/1/2010 |
20.36 |
|
|
| 06488 |
SBI Holdings, Inc |
Japan |
Financials – Securities, AM |
Tokyo / Osaka |
14/4/2011 |
17.405 |
25/6/2014 |
Low trading volume
|
|
06210
|
Vale S.A. |
Brazil |
Materials – Mining |
Brazil / New York |
8/12/2010 |
1337 |
28/7/2016 |
Low trading volume |
| 00945 |
Manulife Financial Corporation |
Canada |
Financials – Insurance |
Toronto |
27/9/1999 |
46.464 |
|
|
|
|
|
|
|
|
|
|
|
Source: HKEX, Bloomberg
WHY DID THOU REJECT OR RETURN?
The Exchange published its annual listing decision on applications that it rejected and returned in the past year. The primary cause for rejection is as follows:
Table 2: Reasons for rejection of IPO application
|
Cause for Rejection
|
No. Applications |
|
Commercial Rationale
|
16 |
|
Valuation
|
4
|
| Suitability of Director / Person with substantial influence |
1
|
| Profit Requirement |
1
|
Source: HKEX-GL126-2020
The Exchange continues its practice to vet the commercial rationale for listing as the main factor in determining suitability. The question on valuation of the business usually rides on the back of the commercial rationale concerns. Based on the drafting of the rejection listing decision, it appears the failure to meet the profit requirement stems from a lack of understanding of the Listing Rules. These rejection highlights the importance of careful homework, planning and independent advice on the part of these companies that would have saved them a lot of money and heartache.
The Exchange highlighted two returned applications last year and provided more guidance on the inclusion of financial information rule on the application process which may suggest a substantial number of applications were returned as it fell afoul of this rule. For simplicity, we provided a tabular version of the guidance.
Table 3: Financial Performance disclosure requirements
|
Application Date
|
Company Year End |
Must listing by (MB) |
Must listing by (GEM) |
Financial performance disclosures in the Application Proof (Main Board) |
Financial performance disclosures in the Application Proof (GEM) |
Financial performance disclosures in the Prospectus (Main Board) |
Financial performance disclosures in the Prospectus (GEM) |
Other Conditions |
|
Between 1 January 2020 and 29 February 2020
|
31-Dec-19 |
No later than 31 March 2020 |
No later than 29 February 2020 |
2017, 2018, 9M2019 |
2018, 9M2019 |
2017, 2018, 2019 |
2018, 2019 |
HKEX-GL56-13, HKEX-GL25-11 |
|
Between 1 March 2020 and 30 June 2020
|
31-Dec-19 |
|
|
2017, 2018, 2019 |
2018, 2019 |
2017, 2018, 2019 |
2018, 2019 |
HKEX-GL56-13
|
| Between 1 July 2020 and 31 August 2020 |
31-Dec-19 |
|
|
2017, 2018, 2019, 3M2020 |
2018, 2019, 3M2020 |
2017, 2018, 2019, 3M2020 |
2018, 2019, 3M2020 |
HKEX-GL56-13
|
| Between 1 September 2020 and 31 December 2020 |
31-Dec-19 |
|
|
2017, 2018, 2019, 6M2020 / 9M2020* |
2017, 2018, 2019, 6M2020 / 9M2021* |
2017, 2018, 2019, 6M2020 / 9M2020* |
2017, 2018, 2019, 6M2020 / 9M2021* |
HKEX-GL56-13
|
* Depending on availability
Source: HKEX-GL127-2020, HKEX-GL56-13, HKEX-GL25-11
Although this appears to be a simple guidance to follow, there were media reports of a large biotechnology company that, was listed earlier this year, had its initial application for IPO returned because it did not adhere the guidance above.
Odyssey Corporate Advisory is a boutique corporate advisor providing independent and impartial investment and capital markets consultancy services catered for your circumstances and preferences. Corporate Advisory is a division of Odyssey Asset Management Ltd, a Type 1, 4 and 9 SFC licensed company and subsidiary of the Odyssey Group. If you have any enquiries, please contact:

Kuan Yu Oh
Managing Director, Co-Head of Corporate Advisory
Mobile: +852 6971-7989
Email: kuanyu.oh@odysseycapital-group.com
Notice
This publication is for informational purposes only and does not address the circumstances of any particular individual or entity. It does not constitute financial advice and should not be used as such. You should seek a duly licensed professional for investment advice. For more information about please see our Disclaimer.

Jul 9, 2020 | Articles, Global Markets Update
Market View
Wild Horses
In June, risk markets defied rapidly rising new COVID cases in the US and powered higher. Admittedly, the 1.8% rise in the S&P 500 was primarily driven by a 7% rise in the Information Technology and a 5% rise in Consumer Discretionary sectors. Commodity markets also took an optimistic view, choosing to focus on the loosening of restrictions rather than the continuing rise in new COVID cases that reached over 200,000 per day. This seems to be affirmation of two beliefs; 1) China’s recovery was gaining traction, and 2) the bet that 2nd wave cases would not result in the wholesale global return of mobility restrictions. This led to WTI oil and copper prices to surge 11% and 12% respectively. Equity markets and currencies that had significant commodity exposure rose accordingly. The once popular economic indicator, the Baltic Dry Index, shot up 260%, mainly on the back of increased iron ore shipments to China.

Source: Bloomberg
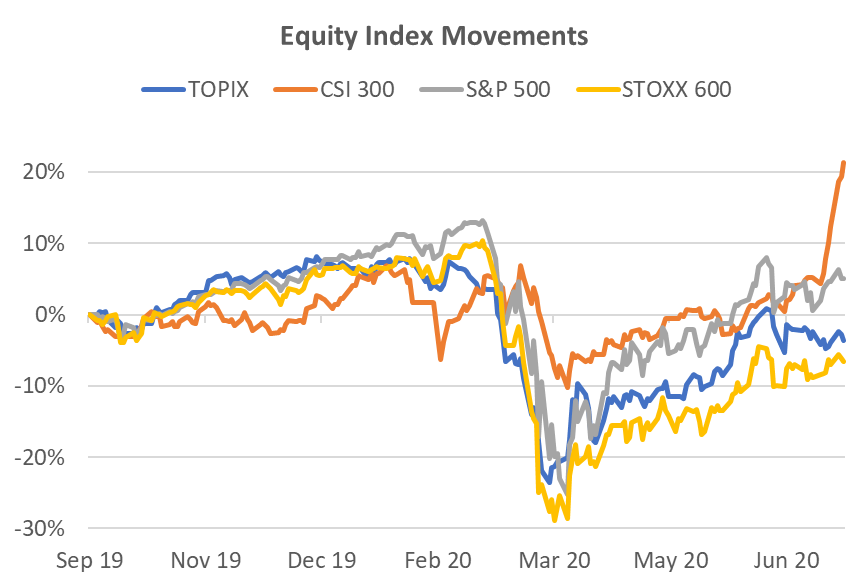
Indeed, China’s improved industrial production, industrial profits and retail sales numbers for May provided a sense of economic stability. When the positive PMI figures were released at the end of June, indicating an improving trend, China’s equity markets initiated one of its infamous “ears pinned back” rallies. Just one week into July, the CSI 300 has jumped 14% and the MSCI China Index has scrambled to keep up with a 9% surge. While the economic data provided a supportive backdrop, it has been the media drive by the government for people to invest in the equity market that is likely to have had a material impact to the speed of the rise. This is reminiscent of the 2015 boom bust where the CSI 300 doubled in just two months but then gave back 80% of the climb in the subsequent two months. The whole up and down move was largely due to government encouragement and then cessation of the media campaign. Hopefully, experience will temper the market enthusiasm this time.
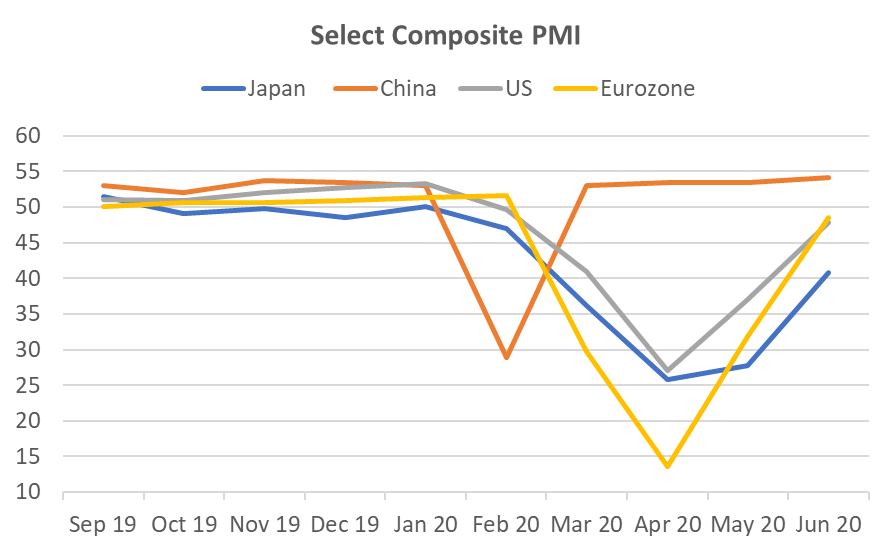
Tail of 4 Markets
The reliability of China’s economic data has been in question since the 1990’s. If we assume it’s a reasonable representation, based on simple PMI comparisons it could be argued that China’s equity market performance should, indeed, be ahead of other major markets. China only suffered one dramatic month’s dip in PMI before heading back to growth again. Other major regions have suffered 3-4 months of below 50 readings. China’s equity market did not fall dramatically until markets in other regions began to plummet. This occurred when you could argue China’s economy was already stabilising.
 Source: Bloomberg
 Source: Bloomberg
The other point worth noting is that both the best performing indices, CSI 300 and S&P 500, have less exposure to offshore revenue than either the Topix or the Stoxx 600 that have more than 60% of revenue from offshore. The means any stimulus is likely to be more efficient for the companies in the China and US indices.
Laggards Still Lagging
The market likes what it likes. Currently that does not include banks and industrial stocks, globally. These sectors tend to be more exposed to lockdown restrictions that have been slower than expected to unwind. In a related statistic, in June, US Growth stocks rose 4.1% while Value stocks fell 1% to continue a well-worn path for the last 10 years with the rise and rise of tech stocks. The eventual recovery of the laggards probably heralds the final phase of the equity market dislocation.
This laggard theme also extends in a smaller scale to the credit markets where Asia corporate bonds remain 230bp wide of US corporate bonds. However, Asian bond credit spreads are steadily grinding tighter against their US counterparts, making it an easier choice than exposures to nominally cheap but unloved stocks.
 Source: Bloomberg
If you like to receive more information on our portfolios solutions, please contact us here: info@odysseycapital-group.com

Jun 15, 2020 | Articles, Global Markets Update
Welcome to the May issue of Odyssey’s Lex Capitis, Odyssey Corporate Advisory’s publication that highlights capital and financial markets developments and its potential implications for you and your business.
Odyssey Corporate Advisory is an independent boutique consultant providing business advisory, investment consultancy, and capital markets project management and coordination services catered for your circumstances and preferences.
It would be an understatement to say that the social unrest in 2019, trade war and Covid-19 presents a challenge for businesses. As we approach the mid-2020, businesses that are considering listing in Hong Kong might find it difficult to meet eligibility requirements unless special dispensation is given by the regulators. So what sort of Hong Kong IPOs should investors expect?
Download the full article here.
Lex Capitis is Odyssey Corporate Advisory’s periodical that highlights capital and financial markets developments and its potential implications for you and your business.
Odyssey Corporate Advisory is an independent boutique consultant providing business advisory, investment consultancy, and capital markets project management and coordination services catered for your circumstances and preferences. Corporate Advisory is a division of Odyssey Asset Management Ltd, a Type 1, 4 and 9 SFC licensed Hong Kong company and subsidiary of the Odyssey Group.
Kuan Yu Oh
Managing Director, Co-Head of Corporate Advisory
Mobile: +852 6971-7989
Email: kuanyu.oh@odysseycapital-group.com
Notice
This publication is for informational purposes only and does not address the circumstances of any particular individual or entity. It does not constitute financial advice and should not be used as such. You should seek a duly licensed professional for financial advice. For more information about please see our Disclaimer.

Jun 10, 2020 | Articles, Global Markets Update
Market View – The Old Normal
Our caution last month proved to be unfounded. The power of the unprecedented stimulus, zero interest rates and the prospect of loosening of lockdown restrictions won the battle against extreme lows in economic activity and the prospect of worst economic data to come. As a result, the World MSCI Index is up 14% since mid-April, and up a whopping 43% since the March trough. The Index now sits at only 6% below the pre-COVID peak. Virtually all risk assets moved up in tandem, including credit. Even oil staged a big rally, rising to USD38 per barrel. The confirmation that the market hadn’t lost all sense occurred last Friday when US unemployment fell to 13.3%, a 1.4% decline from the April figure. This was a particularly large positive shock since some commentators were fearing a number closer to 20%. The other shoe has yet to fall, and those that are waiting, may be in for a long wait. Last week the US interest rate curve steepened 15-25bp for 5-10Y.
Despite market movements, the world is not yet back to normal. The trend in new COVID infections globally is actually still rising. However, the regions that concern the financial markets, namely US and Europe, there the trend is falling, even if the fall is stubbornly slow. Significant restrictions still apply in most countries. The daily new cases in the US still number approximately 19,000, a large quantum.

Source: JHU CSSE
Act 4 in a 5 Act Play
We are now in the 4th Act of the expected 5 Act COVID play for equity markets. The Acts can be characterised as:
Act 1: 3rd week of February. Stocks and other risk assets begin to sell off indiscriminately. The culmination of the first Act was the implementation of the lockdown and social distancing that resulted in the market trough on the 23rd of March.
Act 2: Last week of March. The market realized that there were beneficiaries to the austere policies and we witnessed share prices for online businesses start to surge.
Act 3: 1st week of April. Interest swung to quality businesses that were not beneficiaries of the policies but were partly resistant to the situation and would survive largely intact.
Act 4: Mid-May. The 2nd week of May was when Europe began to loosen lockdown restrictions. By mid-May investors started to support stocks that were heavily affected by COVID policies but were likely to survive as long as the end of the policies remained highly visible. This includes the Banks and Industrial sectors.
Act 5: 3rd – 4th week June? Equity markets to recover their previous peak? Currently, the MSCI World Index is 6% below the pre-COVID peak.
While we have yet to see how Act 5 develops, or whether there is a surprise Act 6 or 7, we find it incredible that it may be possible that in just 4 short months that the equity markets could have plummeted as well as recovered during a time when we are witnessing some of the worst economic data the world has seen since the Great Depression. Indeed, the Global Credit Index (USD corporate bonds) is already up 2% YTD.
Room Left in Laggard Play
While much of the low hanging fruit was picked last week in terms of the under-performing Banks and Industrials, we believe there is still value in the laggard play. Value has been beating Growth in recent weeks, and while this may be a temporary blip to the 10-year Growth out-performance, participating in trend reversals can add meaningfully to performance.
We note that Banks remain 27% below the S&P 500’s peak on the 19th February, compared to Consumer Discretionary, Information Technology, and Healthcare, the sectors that have already regained their previous peaks. Because we are mid-cycle in the laggard recovery, we expect there to be some volatility, but as the global economy slowly climbs out of lockdown, we expect the laggard plays to continue to play catch-up. In Industrials, travel related stocks such as airlines and cruise ships, surged last week. This is likely to remain a highly volatile sub-sector but and may represent a highly sensitive play to the loosening of lockdown restrictions.

Figure 2: Performance of S&P 500 Sectors Since pre-COVID Peak Source: Bloomberg
If you like to receive more information on our portfolios solutions, please contact us here: info@odysseycapital-group.com