
May 15, 2020 | Articles, Global Markets Update
Lex Capitis Odyssey Corporate Advisory’s periodical that highlights capital and financial markets developments and its potential implications for you and your business.
Odyssey Corporate Advisory is an independent boutique consultant providing business advisory, investment consultancy, project management and coordination services for companies that intend to access the Hong Kong capital markets.
Searching for Diamonds in the Rough
Source: Bloomberg, Odyssey Capital
Summary:
- IPOs of Singapore and Malaysia companies during the two months of 2020 have outperformed the market;
- The price-performance of IPOs with cornerstone investors, on average, performed better than IPOs that did not have cornerstone investors during this period. However, stock-specific factors in each IPO were the key determinant in price performance;
- Size matters, on average, during this period as IPO with a market capitalisation that is greater than HK$1 billion performed, on average, better than IPOs market capitalisation less than HK$500 million. However, stock-specific factors in each IPO drove the disparity in price performance.
IPOs during January and February 2020
During the first two months of 2020, 24 companies listed on the Stock Exchange of Hong Kong. 22 companies were listed on the Main Board and two companies on GEM. There was no one particular industry that dominated, with companies ranging from the construction to television industries. Four IPOs (Wenye Group, Wah Wo Holdings, Jiachen Holdings and China Hongguang Holdings) were undersubscribed in their placing offer and one IPO (HuiJing Holdings) was undersubscribed on the public offer.
| Geography |
Board of listing |
No. of IPOs |
Average returns of IPOs |
Average returns of IPOs adjusted by HSSI returns |
| China |
Main Board |
17 |
-27% |
-19% |
| Hong Kong |
Main Board |
3 |
-38% |
-31% |
| Macau |
Main Board |
1 |
-57% |
-54% |
| Singapore |
Main Board |
2 |
43% |
56% |
| Malaysia |
Main Board |
1 |
-6% |
2% |
|
|
|
|
|
| China |
GEM |
2 |
-37% |
-30% |
Figure 1: Average IPO returns
Source: Bloomberg
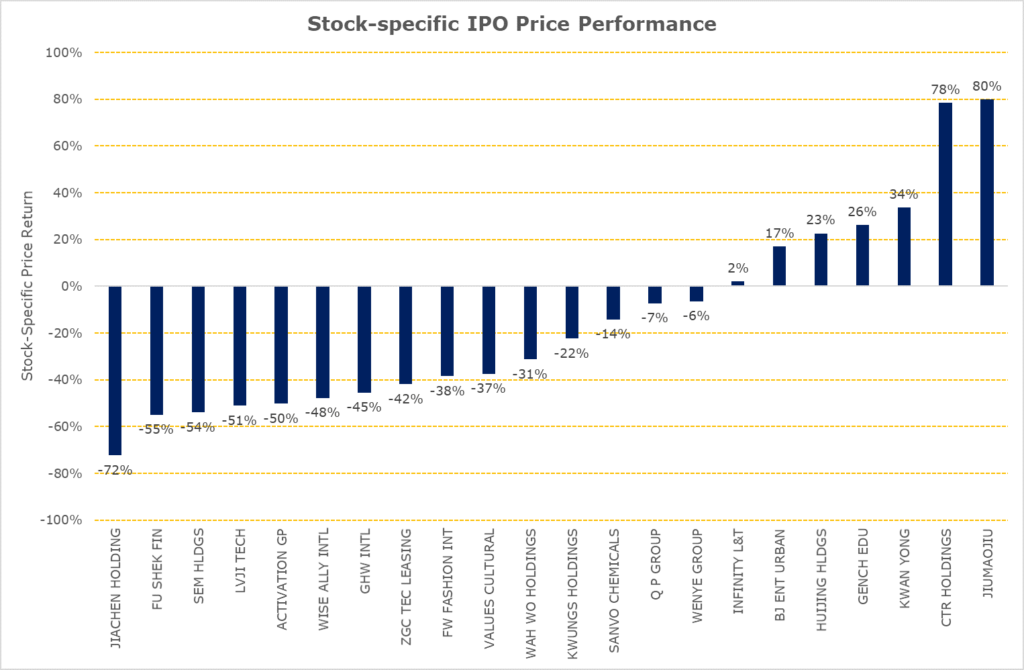
Given the current market environment, we examined the stock-specific returns from their IPO date to 29 April 2020 by adjusting each IPO’s price-performance by the price return of the Hang Seng Composite Small Cap Index (“HSSI”). The HSSI is the appropriate market proxy because the IPO market capitalisation of the companies during this period ranged HK$500 million to HK$10,140 million which is within the scope of HSSI’s constituents market capitalisation. Contrary to an earlier media report about the unattractiveness of South-East Asian companies listing in Hong Kong, investors would, on average, have benefitted from investing Malaysian and Singaporean companies that IPO during this period.
Time to Listing
| Longest application days |
345 |
| Average application days |
198 |
| Shortest application days |
119 |
Figure 2: Timing from application to allotment of Shares
Source: Odyssey Capital
There was no change in the time required for the listing process, the average time from submission of the IPO application until the allotment of shares took more than six months, i.e. it required at least one renewal of the IPO application. The IPO that took the longest was almost a year whilst the shortest took just under four months. There was no discernible difference in the time required between main board applications and GEM board applications.
Size Matters?
| Stock Code |
Name |
IPO Market Capitalisation (HKD Millions) |
IPO returns adjusted by HSSI returns |
| 09968.HK |
HUIJING HLDGS |
10,140 |
23% |
| 09922.HK |
JIUMAOJIU |
9,131 |
80% |
| 01745.HK |
LVJI TECH |
2,990 |
-51% |
| 01525.HK |
GENCH EDU |
2,511 |
26% |
| 03718.HK |
BJ ENT URBAN |
2,484 |
17% |
| 09919.HK |
ACTIVATION GP |
1,616 |
-50% |
| Average Stock-specific IPO Price Performance (Market Capitalisation greater than HK$1,000 million) |
7% |
Figure 3: Large IPOs
Source: Bloomberg
| Stock Code |
Name |
IPO Market Capitalisation (HKD Millions) |
IPO returns adjusted by HSSI returns |
| 02528.HK |
FW FASHION INT |
800 |
-38% |
| 01802.HK |
WENYE GROUP |
630 |
-6% |
| 01412.HK |
Q P GROUP |
628 |
-7% |
| 01442.HK |
INFINITY L&T |
620 |
2% |
| 00301.HK |
SANVO CHEMICALS |
556 |
-14% |
| 01937.HK |
JIACHEN HOLDING |
530 |
-72% |
| 09998.HK |
KWAN YONG |
520 |
34% |
| 01740.HK |
VALUES CULTURAL |
519 |
-37% |
| 01925.HK |
KWUNGS HOLDINGS |
518 |
-22% |
| 09933.HK |
GHW INTL |
510 |
-45% |
| 01601.HK |
ZGC TEC LEASING |
507 |
-42% |
| 01416.HK |
CTR HOLDINGS |
504 |
78% |
| 02263.HK |
FU SHEK FIN |
500 |
-55% |
| 09929.HK |
SEM HLDGS |
500 |
-54% |
| 09918.HK |
WISE ALLY INTL |
500 |
-48% |
| 09938.HK |
WAH WO HOLDINGS |
500 |
-31% |
| 08500.HK |
ICONCULTURE |
250 |
-48% |
| 08646.HK |
CHINA HONGGUANG |
231 |
-13% |
| Average Stock-specific IPO Price Performance (Market Capitalisation less than HK$1,000 million) |
-23% |
Figure 4: Small IPOs
Source: Bloomberg
Although on average, IPOs with a market capitalisation greater than HK$1,000 million performed better than IPOs with a market capitalisation less than HK$1,000 million, there was a wide disparity in price-performance between IPOs. Compared to LVJI Technology Holdings and Activation Group Holdings, 12 small IPOs had smaller negative returns. CTR Holdings and Kwan Yong Holdings had better returns compared to Huijing Holdings which was the largest IPO for the period.
Odyssey Corporate Advisory is a boutique corporate advisor providing independent and impartial investment and capital markets consulting services catered for your circumstances and preferences. Corporate Advisory is a division of Odyssey Asset Management Ltd, a Type 1, 4 and 9 SFC licensed company and subsidiary of the Odyssey Group. If you have any enquiries, please contact:

Kuan Yu Oh
Managing Director, Co-Head of Corporate Advisory
Mobile: +852 6971-7989
Email: kuanyu.oh@odysseycapital-group.com
Notice
This publication is for informational purposes only and does not address the circumstances of any particular individual or entity. It does not constitute financial advice and should not be used as such. You should seek a duly licensed professional for financial advice. For more information about please see our Disclaimer.
May 13, 2020 | Articles, Global Markets Update
Market View
The equity markets have been buoyant for the last 6 weeks. Global virus cases have peaked and many countries have started a tentative process of loosening lockdown restrictions. To assist the recovery, G20 countries have announced a stimulus program that is equivalent to 9.3% of combined GDP, notably supported by close to zero interest rates. This level of stimulus is unprecedented.
On the other hand, we have almost total cessation of activity in very large swathes of the global economy, particularly in the service industries that constitute 65%-75% of GDP for Europe and the US. This sector employs a similar level of the workforce. US unemployment has already reached 14.7% with a 2% lower participation rate. Unemployment rates in the US and Europe are expected to peak in Q2 with significant recovery by year end. Whether the current valuations of the equity market are justified depends on the speed at which lockdown measures are removed and how rapidly the global economy normalizes.
In the last three recessions, it has taken an average of approximately 4 years for earnings per share and the unemployment rate to reach the previous peak. This is clearly not what the market is expecting with the huge stimulus in place. The 2021 estimated PER for the S&P 500 is close to 18x, approximating the highest level for the last 5 years and a level that hasn’t been breached since the Dotcom boom, twenty years ago.
Muddying the situation is that famous brands that are weathering the lockdown well are at all-time high two year forward PERs. We all know of the usual suspects that have benefited from the lockdowns such as Netflix and other online businesses, as well as pharmaceutical companies share that have skyrocketed due to their work on a vaccine. However, some of the largest consumer discretionary companies that have been negatively affected by the virus, but are expected to bounce back strongly, are also at highly elevated valuations. This is in contrast to those businesses seen as the most vulnerable to the virus where valuations have plummeted. Unlike previous deep recessions, the high-quality businesses you want to own for the long term never really became cheap. As Warren Buffet recently lamented “we don’t see anything attractive to do”.
We have entered the statistically weaker May-Oct period for equity markets. So far, sentiment has been buoyant due to prospect of lockdown restrictions loosening. The market is like a prisoner getting excited at the prospect of getting out of jail. However, once we are out, reality will set in and the hard slog of getting back into a normal life begins. There will be times when we wonder why we were so excited, and for many, finding a job in the real world will be very difficult for some time.
The US market bounce from the bottom has been rapid. From its March 23 trough, the S&P 500 has taken just 26 days to regain 60% of its previous peak after the 34% fall. Following the 2008 GFC, it took 373 days to reach this level of recovery. Perhaps, this is a tough comparison since the market fell 57%. The closest in terms of peak to trough fall and the speed of the fall was the 1987 Crash when the market fell 33% in the space of days, but then it took 469 days to recover 60%. The fastest recovery before the current situation is the 1990-91 recession. Here, the peak to trough was only 20%, but the 60% recovery was reached in 111 days. The market appears to be expecting that the huge stimulus package, zero interest rates, and the fact that this recession was caused by government actions specific to the Coronavirus and therefore, can be undone by the reversal of those policies, to be the game changers.

Figure 1: Market Crash Comparison Source: Bloomberg, Odyssey Capital
Where is the Value?
The speed of the equity bounce was a surprise. What should not have been a surprise was the transient nature of the huge spike in equity volatility, the level of which rivalled the GFC. That was an excellent time to be short equity volatility in structured products where you were overly compensated for risk. Now that the volatility opportunity has faded, what are the current opportunities?
On a relative basis, valuations for Asian and European equity indices are close to their nadir relative to the US. While European equities show the same symptoms as the US market where resilient quality businesses are priced very expensively, the same characteristic does not appear as prevalent in Asia. For the latter there are still quite a few quality businesses we’d like to own for the long term on historically modest valuations.
By asset class we still prefer fixed income. While the US investment grade indices are already back to where they were at the beginning of the year, BBB spreads remain close to 100bp wider. US high yield (HY) is still trading at a wide credit spread of 720bp, implying a 5yr default rate of approximately 50%. Since the majority of US HY bonds are issued by listed companies, what does it say about the equity value of those companies? What many equity investors may forget is that there is contractual obligation for a company to repay that bond and the interest, and if they do not pay, bondholders can force a liquidation of the company. In such a case, equity holders rank last to receive money, if there is any left. Often, there is not. This payment ranking system is the reason why in a crisis situation corporate credit generally outperforms equity by a wide margin. However, in the last couple of weeks, equity has roared ahead while bond spreads have remained stagnant. This suggests there is a disparity between the corporate risks that bondholders perceive, particularly for high yield, and those that equity holders perceive.
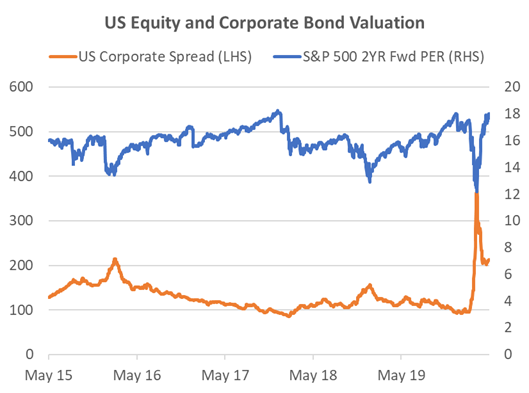
Figure 2: US Equity and Corporate Bond Valuation Source: Bloomberg, Odyssey Capital
In alternatives we also note that some managers are creating new funds to take advantage of the current dislocation in markets, particularly in the private credit space. These provide significant interest. However, we remain a little cautious of ongoing vehicles that have yet to mark down their investments to account for the current business environment. Private investment valuations often show little correlation to the public markets. The only time that changes is when the real economy is affected significantly. Then the correlation is very high, even though it is revealed on a lagged basis.
If you like to receive more information on our portfolios solutions, please contact us here: info@odysseycapital-group.com

Apr 15, 2020 | Articles, Global Markets Update
Welcome to the inaugural issue of Odyssey’s Capital Pulse, Odyssey Corporate Advisory’s quarterly publication that focuses on major capital and financial markets events that occurred during the quarter and its potential implications for you and your business.
Odyssey Corporate Advisory is an independent boutique consultant providing business advisory, investment consultancy, project management and coordination services for companies that intends to access the Hong Kong capital markets.
It has been a busy quarter for the Hong Kong capital markets despite most major economies in the world implementing national border closures and movement restrictions due to COVID-19.
In this inaugural issue we have highlighted interesting regulatory developments from a primary market perspective and our financial market expectations from a secondary market perspective.
Download a copy of CAPITAL PULSE here.
SEARCHING FOR THE LIGHT AT THE END OF THE TUNNEL
For six months ended 31 March 2020, there were 212 applications for listing on the Hong Kong Stock Exchange compared to 255 applications in 2019 and 243 in 2018 based on their first posting date. However, since January 2020, application for listing activity has slowed markedly with only 57 new applications for the first quarter, which is almost a 50% decline in new applications compared to the same quarter in 2018 and 2019. There were 33 approval-in-principle outstanding with 28 approval-in-principle granted during the quarter. 69 applications lapsed but 38 applicants renewed their listing applications representing a 55% renewal rate. Four applications were withdrawn and 139 applications remain in the pipeline.
During the quarter, 40 new companies listed on the stock exchange and two companies were transferred from the Hong Kong GEM Board to the main board under the grandfathering arrangements. This compares to 38 companies in 2019 and 36 companies in 2018 for the same quarter. However, funds raised were significantly lower averaging HK$349 million per IPO which was approximately 40% lower than 2019 and 50% lower than 2018.
Given that measures to contain Covid-19 only started during the quarter, it appears that the slowdown in fund raising activity was well underway since mid-late 2019 given the time required for the raising equity capital, if not for Alibaba’s secondary listing on and Budweiser APAC IPO. Unfortunately, the slowdown is expected to continue given lower market valuations even though it has been reported in the media of an expected mega-IPO by the end of this year. Unlike traders where day-to-day market fluctuations matters, equity capital raising require significantly amount more time making current market conditions less relevant for companies planning such an undertaking.
THE MORE THINGS CHANGE, THE MORE THEY STAY THE SAME
Every market crisis may have a different root cause, but the market reaction to each crisis may not be so dissimilar. Even in the post GFC a low interest rate environment, we still witness the classic decade long cycle between major financial crisis. Although we have experienced average weekly swings in the Hang Seng Index (“HSI”) of over 800 points per week since the beginning of the year, it would come as no surprise that there will be more volatile markets in the foreseeable future.
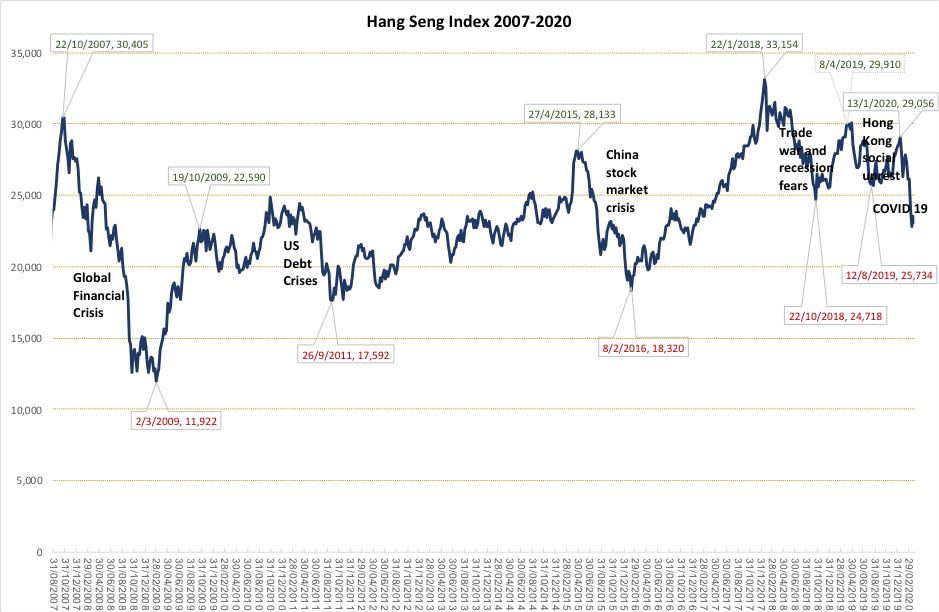
Figure 1: Hang Seng Index (Weekly)
Apart from the GFC when the HSI fell almost 20,000 points over 16 months, the last significant correction was in 2015-2016 during the China stock market crisis when the HSI fell 10,000 points over 9 months. However the long-term picture indicates that we are now experiencing the somewhat overdue major correction in this decade long market cycle.

Figure 2: Covid-19 versus SARS market experience
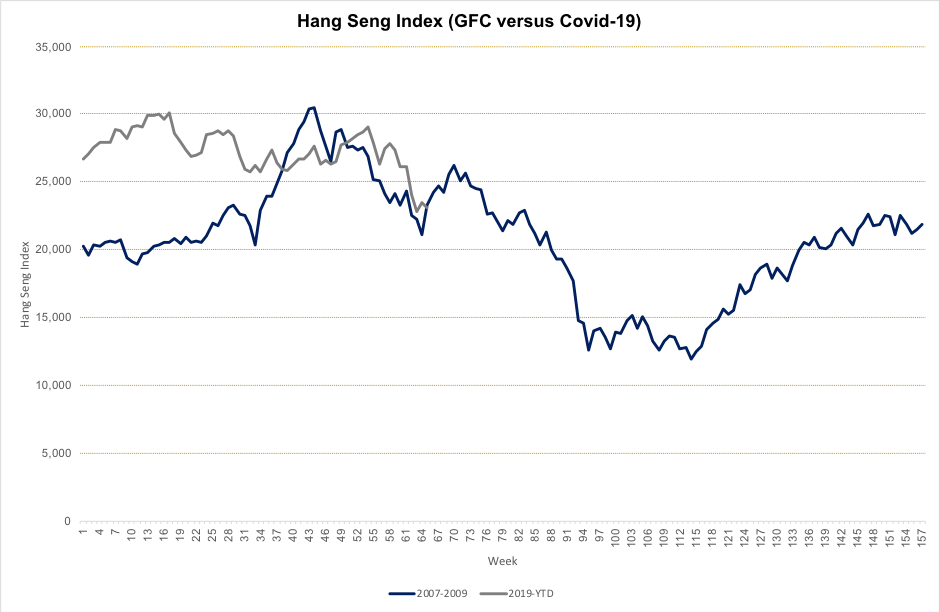
Figure 3: Covid-19 versus GFC market experience
Whilst not suggesting that history is expected to repeat itself, there are a couple of points that history could serve as a guide. Apart from much greater volatility, the market tends to require a longer period to digest the magnitude and economic consequences of each crisis. There is one major difference between SARS and Covid-19, namely SARS predominately affected the Greater China region whereas Covid-19 has global footprint, and the associated economic problems are expected to be more pronounced and perhaps prolonged. Therefore it appears the GFC market experience might be a better proxy than SARs.
Volatility, volatility and more volatility
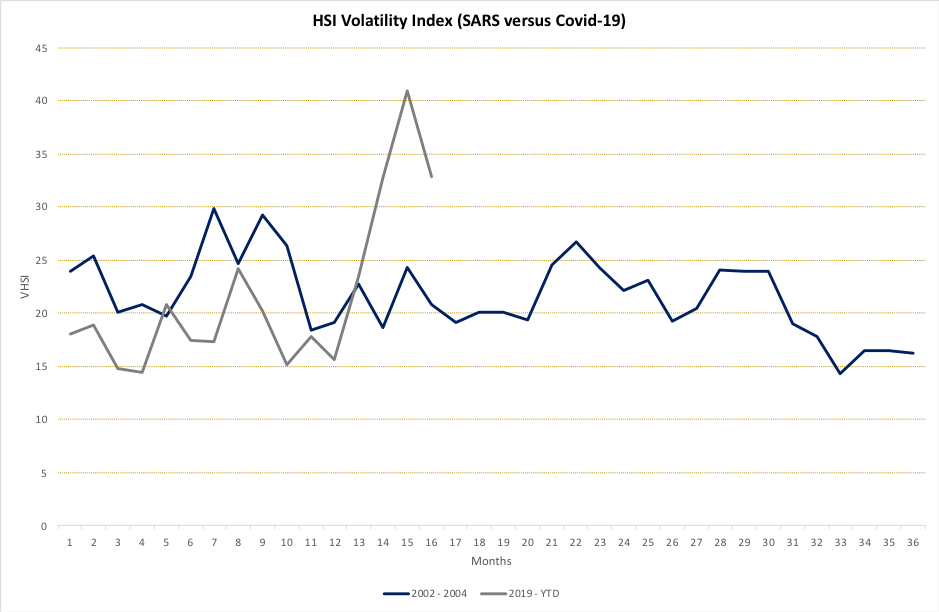
Figure 4: Covid-19 versus SARS volatility experience
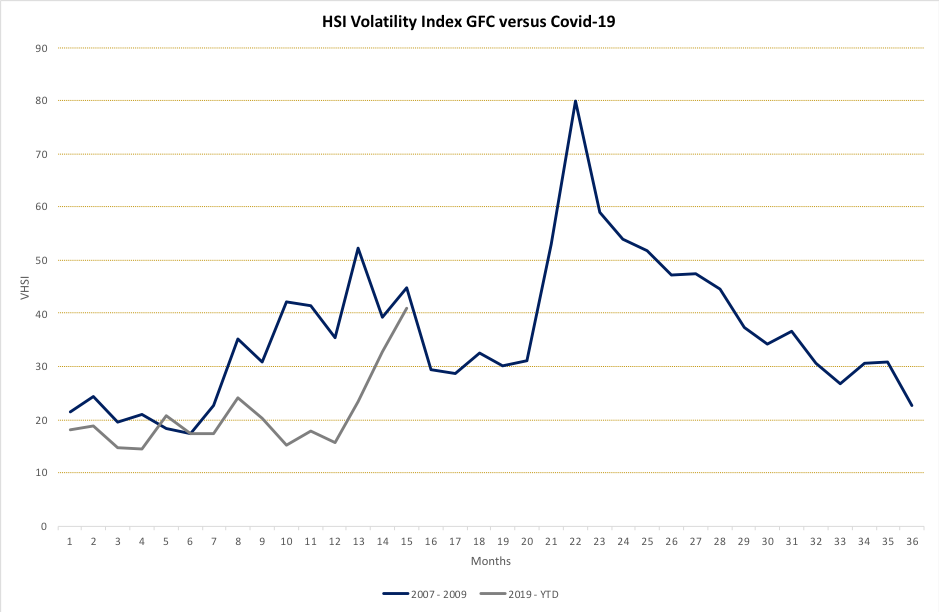
Figure 5: Covid-19 versus GFC volatility experience
The behaviour of the HSI Volatility Index further demonstrates the parallels between the current market environment and the GFC rather than SARS where less volatility in the equity markets. If the GFC experience is any guide, we are nowhere close to the end of the tunnel. Investors should be wary of V-shape, W-shape or U-shape economic predictions given the extreme uncertainty.
The key takeaway is companies need to manage their capital positions carefully during the next few quarters as cost of equity will remain expensive and there may be little appetite for capital issuance in general. Those companies who would like deploy excess cash to take advantage investment opportunities in current market conditions should be aware that something that looks cheap can become (a lot) cheaper. Such investors need to stay vigilant in filtering out the noise in the market in their investment decisions.
NOTABLE REGULATORY INITIATIVES DURING THE QUARTER
Consultation on Corporate Weighted Voting Rights
The stock exchange published its consultation paper on corporate weighted voting rights on 31st January 2020. This is a follow-up to the weighted voting rights rules implemented on 24 April 2018 that applies to individual shareholders and the stock exchange’s decision to defer this consultation on 25 July 2018. Put simply the rationale for the corporate weighted voting rights are namely:
- Companies that are considered innovative by regulators have an ownership and business operating environment which is crucial for the success of the business that necessitates super-voting shares or weighted voting rights;
- It will affect the valuation of such company by stock analysts; and
- The competition allows it, if the stock exchange does not follow suit, it will lose business.
However, what about minority shareholder protection under the listing rules? The proposed protection measures include limiting the life of corporate weighted voting rights to ten years and the corporate weighted voting rights beneficiary must actively drive the business of the listing applicant. Also, size matters as the market capitalisation of the beneficiary entity of the weighted voting rights must be at least HK$200 billion (approximately US$25 billion) and the market capitalisation of the listing applicant must not account for more than 30% of the market capitalisation of such entity.
The consultation paper tries to present a balance view for allowing corporate weighted voting rights and similar points were previously presented in the 2018 consultation paper. Whilst a full response to the current consultation paper is outside the scope of this Quarterly update, it is interesting to observe the corporate governance measures for corporate weighted voting rights are similar to those implemented for individual weighted voting rights even though minority shareholder protection under corporate weighted voting rights maybe more complex. Further as the stock exchange plays catch-up with its competitors, it seems that this is a missed opportunity to cater the listing rules for other industries that may have similar operating environment but are not currently considered “innovative”. Nevertheless, the creation of such rules are beneficial for innovative companies choosing to list in Hong Kong and may benefit investors by extending the range of investee companies. One small point to note, if you would like to provide feedback on this consultation paper, the deadline is 1st May 2020. Perhaps an extension of the deadline might be helpful given the current environment.
Guidance and training on Environmental, Social and Governance
The term Environmental Social Governance (“ESG”) was made popular from a 2005 in a joint study by financial institutions and supported by the Swiss government on the back of an invitation of the then UN General Secretary Kofi Annan to develop guidelines and recommendations on integrating environmental, social and corporate governance issues in the financial services. It draws up qualitative factors that investors should consider to judge the sustainability of a business such as:
| ESG |
Typical Qualitative Factors |
| Environmental |
Resource exploitation
Pollution
Climate change |
| Social |
Workplace exploitation
Diversity policies and practices
Community engagement |
| Governance |
Business ethics
Corruption
Remuneration policy and practices |
Table 1: ESG Factors
In summary, the emphasis is on the listed company to explain its ESG policy and approach to the investing public rather than to focus on specific areas. It leaves a free-hand to the company to explain the material ESG risks of the business in the ESG report following a policy of “comply or explain”, i.e. if an ESG risk is not relevant or material to the company then it can explain why such disclosure is unnecessary. This is a positive step towards establishing a minimum standard of reporting to investors, especially since ESG funds a more recent trend in asset management products and incorporation into investment processes in the Asia Pacific region as opposed to the US and European counterparts. The Global Reporting Initiative or GRI standards is a reference for a deeper discussion of ESG issues.
OTHER HOUSEKEEPING MATTERS
Guidance provided to companies due to Covid-19
The regulators issued a Joint guidance on results announcement in light of the travel restrictions relating to Covid-19 on 4th February 2020 and 16th March 2020, and an FAQ on this topic on 28th February 2020. Listed companies are requested to consult with the Exchange on their ability to meeting their financial results announcement obligations in light of the Covid-19 and are required to publish material financial information to maintain their trading status. Listed companies may defer the publication of its annual reports due on 31st March 2020 and 30th April 2020 initially for up to 60 days from the date of the 16th March 2020 joint guidance statement if the company has published, on or before 31st March 2020 financial information specified therein.
Streamlining of Guidance Letters and FAQs relating to listing matters
The listing department has updated their guidance to the market pertaining to issues relating to controlling shareholders, mineral applicant companies and distributorship business. Thus far, there has been three new guidance letters, 20 updates to guidance material to the market and 54 withdrawal of the same as part of this streamlining initiative.
The update to controlling shareholder guidance letter is a minor housekeeping item to incorporate the principle that the ownership continuity and control requirement applies to the single largest shareholder when an applicant does not have a controlling shareholder, which was previously published in FAQ Series 1 No.16 that has been withdrawn.
Similarly, the update to the minerals companies guidance letter draws principles from eight guidance materials that have been withdrawn pertaining to disclosures in the prospectus and competent persons report such as conditions for exclusion of assets in such report but supplemented by alternative disclosure in the prospectus.
There have been further clarifications provided in the updated guidance letter to applicants that are distributorship businesses on issues of which parties are considered distributors and sub-distributors, and risk disclosure requirements on cannibalisation and control over sub-distributors on the business model.
Odyssey Corporate Advisory is a boutique corporate advisor providing independent and impartial investment and capital markets consultancy services catered for your circumstances and preferences. Corporate Advisory is a division of Odyssey Asset Management Ltd, a Type 1, 4 and 9 SFC licensed company and subsidiary of the Odyssey Group. If you have any enquiries, please contact:
Kuan Yu Oh
Managing Director, Co-Head of Corporate Advisory
Mobile: +852 6971-7989
Email: kuanyu.oh@odysseycapital-group.com
Notice
This publication is for informational purposes only and does not address the circumstances of any particular individual or entity. It does not constitute financial advice and should not be used as such. You should seek a duly licensed professional for investment advice. For more information about please see our Disclaimer.
Apr 9, 2020 | Articles, Global Markets Update
Outlook
Despite heightened worries about the impact of the virus on the US, we believe data is consistent with our base case (60% probability) in which new virus cases peak by mid-April in Europe and the US; the most severe restrictions are lifted from May; and a coordinated monetary and fiscal response allows for a V-shaped recovery to take hold from the third quarter of this year with rapid acceleration in the fourth quarter. UBS “expects to see evidence by mid-month that the US is starting to bend the curve. In Europe, we see more compelling evidence that governments in Italy, Germany, France, and Spain are bending the curve now”.
Market developments over the coming weeks will hinge on four key factors: First, whether we see further evidence that containment measures are slowing infection rates. Second, whether announced government stimulus measures are actually succeeding in preventing job losses and bankruptcies. If governments can do this, then we could expect a relatively swift recovery in demand when economies reopen ie to ‘preserve capacity’. Thirdly central banks’ measures to prevent a liquidity crisis work in the next 2-3 months and thus stop a solvency crisis developing that might result in a severer recession or even a depression (and a far worse public healthcare crisis than this virus). Lastly evidence of a slowdown in infections and lower morbidity rates, as the use of better therapeutics make treatment more effective, should reduce fear and pessimism.
We believe markets are past the peak in panic seen in mid-March but very poor macro data, and the rising death toll, may mean we are not yet at maximum pessimism and that a retest of the 23rd March lows at 2,237 on SPX and 10year US Treasury yield at 31bps are quite possible and this fits with previous corrections needing markets to form a ‘double-bottom’. We would look to deploy cash and reposition defensive assets, as some of our Alternatives, into riskier assets into such declines.
With equities and lower quality bonds offering the most attractive valuations since 2016, higher risk investors can put excess cash to work via an averaging-in strategy. In addition, investors can buy gold as increasingly the only genuine ‘safe haven’ asset. We see opportunities in Asian equities that are relatively cheap and whose earnings impact from the virus is likely to be relatively limited, as well as quality stocks globally, that can protect dividend payments, that should be resilient.
We think credit is closer to pricing in our downside scenario than equities, and US investment grade, US high yield, and US dollar-denominated emerging market sovereign bonds all offer attractive opportunities after selling-off to levels last seen in the GFC. To put this into perspective US HY spreads over USTs blew-out by over 1,000bps, similar to the fall in GFC, which implies a 50% default rate over the next five years whereas SPX, using our estimates for ‘normalised’ earnings in FY21, is trading at just under 15x vs. the long-term 16.6x average and on over 2x PBV that is decent value but hardly a bargain. The explosive rally in equity markets late March means they are closer to pricing in our base case scenario and the need to be more selective. Equities main attraction is they look cheap relative to high quality bonds and offer better income too.
When to Downgrade the Lockdown?
A real concern is that unless economic activity is restored relatively quickly, companies with much reduced, or no, revenues will face a solvency issue and this risk is made worse by a record high debt to equity level that could lead to a Depression via a horrific credit crisis – surely a danger most governments would seek to avoid? We might not be able to contain the virus, but we can avoid triggering a solvency/credit crisis that may have other enormous public health consequences.
Perspective: Fullerton’s “letter”
We will like to end this off with a speech from former Capital Group Chairman Jim Fullerton. He delivered this speech in Nov 1974 amid a prolonged bear market and provides us with a historical perspective, and some optimism, in a market environment like what we are in today.
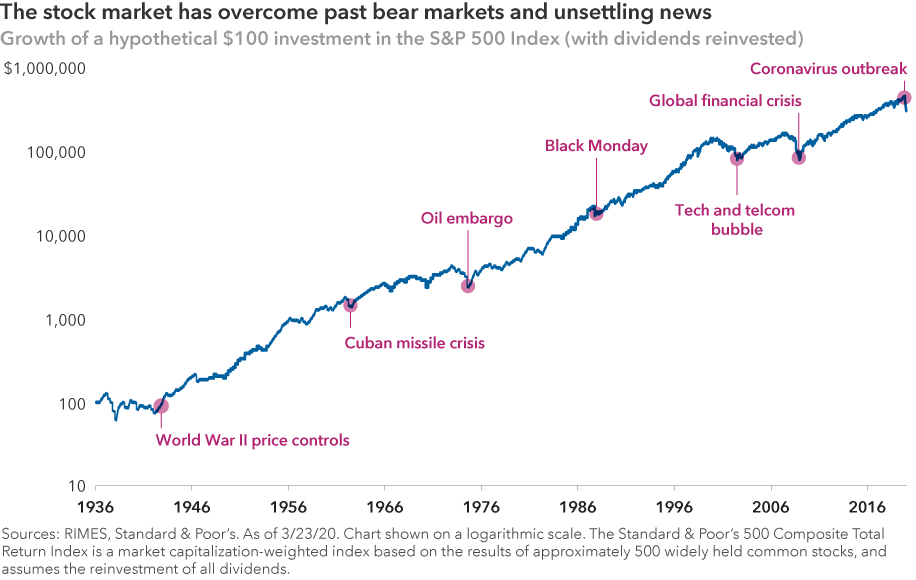
Figure 1: Stock markets’ resilience Source: Capital Group
The speech is as follows:
“Courage! We have been here before”: One significant reason why there is such an extreme degree of bearishness, pessimism, bewildering confusion, and sheer terror in the minds of brokers and investors alike right now, is that most people today have nothing in their own experience that they can relate to, which is similar to this market decline. My message to you, therefore, is: Courage! We have been here before. Bear markets have lasted this long before. Well-managed mutual funds have gone down this much before. And shareholders in those funds and we the industry survived and prospered.
I don’t know if we have seen the absolute bottom of this prolonged bear market, (although I think we’ve seen the lows for a lot of individual stocks). Each economic, market and financial crisis is different from previous ones. But in their very difference, there is commonality. Namely, each crisis is characterized by its own new set of nonrecurring factors, its own set of apparently insoluble problems and its own set of apparently logical reasons for well-founded pessimism about the future.
Today there are thoughtful, experienced, respected economists, bankers, investors and businessmen who can give you well-reasoned, logical, documented arguments why this bear market is different; why this time the economic problems are different; why this time things are going to get worse — and hence, why this is not a good time to invest in common stocks, even though they may appear low. Today people are saying: “There are so many bewildering uncertainties, and so many enormous problems still facing us — both long and short term — that there is no hope for more than an occasional rally until some of these uncertainties are cleared up. This is a whole new ballgame.”
A whole new ballgame: In 1942 everybody knew it was a whole new ballgame. And it was. Uncertainties? We were all in a war that we were losing. The Germans had overrun France. The British had been thrown out of Dunkirk. The Pacific Fleet had been disastrously crippled at Pearl Harbor. We had surrendered Bataan, and the British had surrendered Singapore. In April 1942, inflation was rampant.
Today almost every financial journal or investment letter carries a list of reasons why investors are standing on the sidelines. They usually include (1) continued inflation; (2) illiquidity in the banking system; (3) shortage of energy; (4) possibility of further outbreak of hostilities in the Middle East; and (5) high interest rates. These are serious problems.
But on Saturday, April 11, 1942, The Wall Street Journal stated: “Brokers are certain that among the factors that are depressing potential investors are, (1) widening defeats of the United Nations; (2) a new German drive on Libya; (3) doubts concerning Russia’s ability to hold when the Germans get ready for a full-dress attack; (4) the ocean transport situation with the United Nations, which has become more critical; and (5) Washington is again considering either more drastic rationing with price fixing or still higher taxes as a means of filling the ‘inflationary gap’ between increased public buying power and the diminishing supply of consumer goods.” (Virtually all of these concerns were realized and got worse.)
On the same day, discussing the slow price erosion of many groups of stocks, a leading stock market commentator said: “The market remains in the dark as to just what it has to discount. And as yet, signs are still lacking that the market has reached permanently solid ground for a sustained reversal.” Yet on April 28, 1942, in that gloomy environment, in the midst of a war we were losing, faced with excess profits taxes and wage and price controls, shortages of gasoline and rubber and other crucial materials, and with the virtual certainty in the minds of everyone that once the war was over we’d face a post-war depression in that environment, the market turned around.
A return to reality: What turned the market around in April of 1942? Simply a return to reality. Simply a slow but growing recognition that despite all the bad news, despite all the gloomy outlook, the United States was going to survive, that strongly financed, well-managed U.S. corporations were going to survive also. The reality was that those companies were far more valuable than the prices of their stocks indicated. So, on Wednesday, April 29, 1942, for no apparent visible reason, investors again began to recognize reality.
The Dow Jones Industrial Average is not reality. Reality is not price-to-earnings ratios and technical market studies. Symbols on the tape are not the real world. In the real world, companies create wealth. Stock certificates don’t. Stock certificates are simply proxies for reality.
Now I’d like to close with this: “Some people say they want to wait for a clearer view of the future. But when the future is again clear, the present bargains will have vanished. In fact, does anyone think that today’s prices will prevail once full confidence has been restored?” That comment was made 42 years ago by Dean Witter in May of 1932 — only a few weeks before the end of the worst bear market in history. Have courage! We have been here before — and we’ve survived and prospered.
If you like to receive more information on our portfolios solutions, please contact us here: info@odysseycapital-group.com
Mar 24, 2020 | Articles, Global Markets Update
February was a tumultuous month for markets, which saw an elevated level of volatility across asset classes that extended even further into early March. Just as the coronavirus appeared to have come under some extent of control in China and other regions, Italy, South Korea and Iran quickly turned into hotbeds of infections and now increasingly, it looks like the rest of Europe and the U.S. will not be spared. Concern over how this would affect growth across these regions prompted a flight to safety, pushing the S&P 500 down -8.41% MoM, and sending the benchmark 10Y US Treasury Yield below 1% for the first time ever, and yields in Europe deeper into negative territory.
While equity markets were down across the board (the MSCI All-country World Index fell -8.21% MoM), the U.S. and Europe (the Stoxx 600 was down -8.54% MoM) saw a much steeper decline compared to their Asian counterparts like China A-shares (-3.22% MoM), the HSI (-0.69% MoM) and the broader MSCI Asia ex-Japan Index (-2.91%). The MSCI ASEAN Index (-9.29% MoM) underperformed, however, not least as markets grew concerned that this highly trade-dependent region would be significantly affected by a slowdown in global growth.
Understandably, oil prices also fell on similar concerns, with the price of Brent Crude off -13.14% MoM to US$58.16/bbl, sending Energy shares in the S&P 500 down -15.27%, and Oil & Gas names in the Stoxx 600 down -13.27% over the month.
On the U.S. political front, we saw Joe Biden take the DNC by storm, surprising markets with a strong comeback to take ten of the fifteen contests on Super Tuesday to prompt Bloomberg, Warren and Buttigieg to drop out of the race in quick succession to leave the contest between him and Bernie Sanders.
OUTLOOK
We are not supportive of a recession thesis in the U.S. nor globally, and do not think that we will be seeing a global pandemic. Our base case is that ‘this too shall pass’, but perhaps later than we had initially expected with the next four to six weeks being a tricky period as developed markets weigh the potential damage against reflation measures. Our sense is that the actual damage from the virus is far, far less than the fear of it but sooner than later fear will turn into realism. In our view, this pattern of behaviour might continue well into April.
Morgan Stanley’s strategists have opined a similar base case to mine, in that the virus will continue to spread into 1H20 before tapering off. In this case, global growth will likely see half a percentage point shaved off to c. 2.5%, but we will avoid a recession altogether. Their/our bull case scenario would see the spread taper off by late March, while the bear case sees it spreading well into 2H20 and thus result in global growth dropping to as low as -2.1% and a likely recession even if the Fed cuts by as much as 125bps. As such, anything less than the most drastic, worst-case scenario would suggest that the selloff will come to pass, and not indicative of the end of the cycle.
Having adopted a relatively conservative stance up to this point, we committed a portion of our cash pile last Friday when U.S. markets came off. We seek to cautiously use further dips to add to equities, and possibly high yield fixed Income if we see markets dip further. We see no reason to rush back into markets but will keep a close eye on technical indicators as opportunities to deploy capital might present themselves(Thursday’s fall took the S&P 500 a percentage point below Its 200DMA, with the Dow now 4.5% below, although Nasdaq remains above this level).
We expect further volatility as markets attempt to price in the short-term impact of the virus, effects of reflation in the medium to long-term, as well as political risks in the U.S. Over the next four the six weeks, however, it is more than likely that the virus will be the key driver. With the U.S. arguably being too complacent around the situation, they will undoubtedly go into high gear and exaggerate risks through far more draconian measures that will hurt sentiment – therefore we remain cautious in adding to U.S. equities.
We remain far more optimistic around China and the broader Asia ex-Japan region (bar South Korea), as they have adjusted to the situation and are now coming out the other side as infection rates slow, and markedly so in the case of China. Reflation in Asia ex-Japan seems to be more aggressive too – Singapore and Malaysia, for example, are boosting fiscal spending by a combined c. $9bn which is larger than the $8bn plus US Congress had earlier sought to pass.
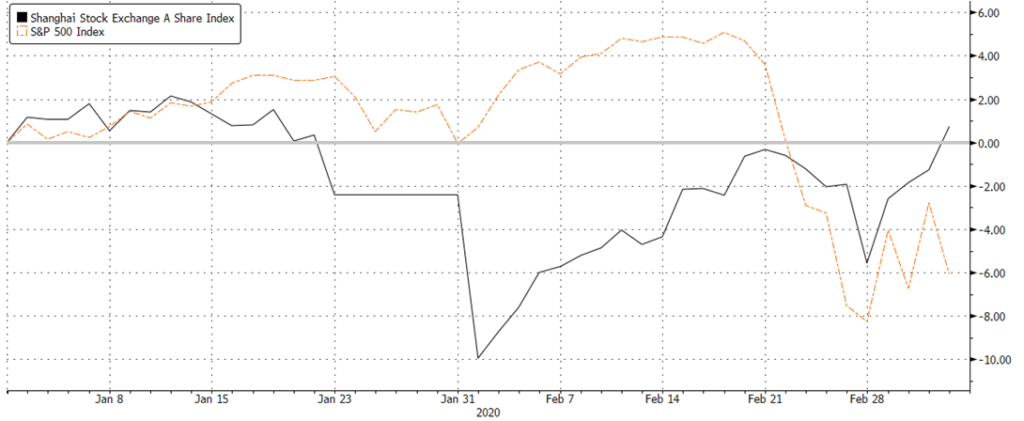
Figure 1: A-shares outperformance towards end Feb Source: Bloomberg
We believe that the Fed has made a big error in cutting rates by 50bps, and this is a view that appears to be shares by quite a few others. There is no evidence that the US economy is or will be too badly damaged by the virus, especially after recent data releases which have been fairly supportive (ISM Manufacturing showed signs of recovery, while consumer data remained solid). A move like this comes across as more of trying to please the markets rather than being responsible, and to do it before Super Tuesday results were out beggars belief. The Fed has now used up a decent chunk of its ammunition, helped UST yields plunge to all-time lows, dumped the US Dollar and arguably created more worry than confidence as many might wonder why the Fed might make such moves. Fixed Income markets are now expecting 100bps of cuts in ’20 from just 25bps at the end of February.
This has sharply lowered the real interest rate differential USD had, and both the EUR & JPY reacted sharply to the Fed’s daft move, reigniting the latter’s ‘safe haven’ attributes which appeared to have been lost in last month’s selloff. With the virus spreading quickly into other developed markets, Japan’s poor handling of its spread is less of a negative. Indeed China and Singapore (Vietnam, too, has been quick to be strict on its approach) might be the exceptions, with other countries potentially far less able to handle an outbreak.
The collapse in yields – whilst probably good for mortgage refinancing and property demand – now suggests a deeply negative real rate. That suggests that FI markets think an imminent and severe recession may well be on its way soon, as compared to equity markets that are still not materially off all-time highs. This extreme dichotomy cannot last and my base case is that FI markets are exaggerating the risks, instead driving up bond prices to make the asset class effectively uninvestable bar short-term tactical trades.
This further underlines the relative attraction of cash vis-à-vis Fixed Deposits (3M LIBOR is now at 1% from 1.7% a month earlier), and also why we prefer to diversify into alternative income and alternatives more generally. We would consider looking at senior loans, on the basis that rates cannot get much lower (can they?) and have capped lower limits. Once things stabilize, the low base of US Treasury yields will further add to demand for positive yielding FI assets, not least High Yield bonds (The US HYG ETF is yielding 5.08%, thus providing a yield pick-up of over 4.2%). Having said that, there remains a concern around default risks jumping higher if the virus was to harm FCF generation, and not just the energy/oil-related CCC bonds either.

Figure 2: Chart showing DXY performance since 1994 Source: Bloomberg
In currencies, we wonder if this could be the inflection point for the US dollar. USD has plunged 3% WTD on the Fed’s move, with JPY storming back from the 110 level to test a key support at 105. EUR was also up sharply from its recent low of 1.0800. Both the ECB and BOJ may well ease next week/end March respectively, but probably along the lines of a 10bps cut compared to the Fed which some see cutting by a 100bps by the end of the year. Both Japan and the EU are likely to undertake far more expansive fiscal spending than the US might, given the high chance of partisan gridlock In the latter. If Germany was to abandon its idiotic zero deficit fiscal stance, this would boost EUR sharply. In our view, the DXY may have peaked at its 20Y high at c. 100.
![]()
![]()
![]()
![]() EQUITIES
EQUITIES
Markets in the US continued into all-time high territory throughout the most of February, though the tail end of the month into early March saw heavy selling amid Covid-19 concerns with the US starting to see its first few cases of the highly infectious virus. Last week was the S&P 500’s worst weekly decline since Oct ’08, with bank stocks taking a particularly hard beating (the widely-followed KBW bank index fell by as much as 20.7% from its Jan high) across a broader market selloff, and rising expectations of further rate cuts. Both the S&P 500 and Dow fell into a technical recession.

Figure 3: Performance of major US indices in Feb ’20 Source: Bloomberg
All sectors in the S&P 500 closed lower in the month of Feb, although defensive sectors like Telecommunications, Real Estate and Health Care were noticeably more resilient. Energy shares saw the steepest decline at -15.27%, extending January’s loss and weighed lower by a significant decline in oil prices which sold off on concern over a potential fall in global growth which would result in less demand.

Figure 4: S&P 500 sector returns in Feb ’20 Source: Bloomberg
Nevertheless, economic data showed some relative strength in the US economy, with University of Michigan’s US consumer sentiment survey coming in at 100.9 (vs est. 99.5), while retail sales rose 0.3% MoM in Jan to meet economists’ expectations. Headline PPI also beat estimates handily to rise 2.1% YoY in Jan (vs est. 1.6%). Home data was positive over the month, with new home sales up 7.9% in Jan to its strongest since mid ’07 on the back of cheaper borrowing costs, while home prices in 20 cities were up 2.85% YoY in Dec. Consumer confidence also edged higher in Feb to its best level in over half a year.
European markets were not spared from the bloodbath, not least with ECB chief economist’s warning that the coronavirus would be a ‘pretty serious short-term hit’ to Europe’s economy. The moves across indices were fairly similar, with all three major indices seeing a similar 8-9% move down alongside the Stoxx 600.

Figure 5: Performance of major European indices in Feb ’20 Source: Bloomberg
Within the Stoxx 600, all sectors saw losses although Oil & Gas and Travel & Leisure names took an understandably worse beating considering the outbreak compared to other sectors, although Basic Resources, Insurance, Media and F&B were not too far off. Notably, however, Utilities – often seen as a bond proxy and now more so given the rapid decline in bond yields – outperformed with only a -2.96% decline relative to the double-digit loss seen across sectors.

Figure 6: Stoxx 600 sector returns in Feb ’20 Source: Bloomberg
Most markets in Asia were also down, though much of the fallout had already happened over the course of January, and losses were relatively muted compared to indices in the US and Europe. The NIKKEI and MSCI ASEAN were the biggest losers in the region, falling -8.05% and -7.96% respectively. Perhaps in-line with the situation looking more contained in China and given the heavy selling which we saw earlier last month, China A-shares outperformed at +4.87% to be the only big index in this region to close positive this month.
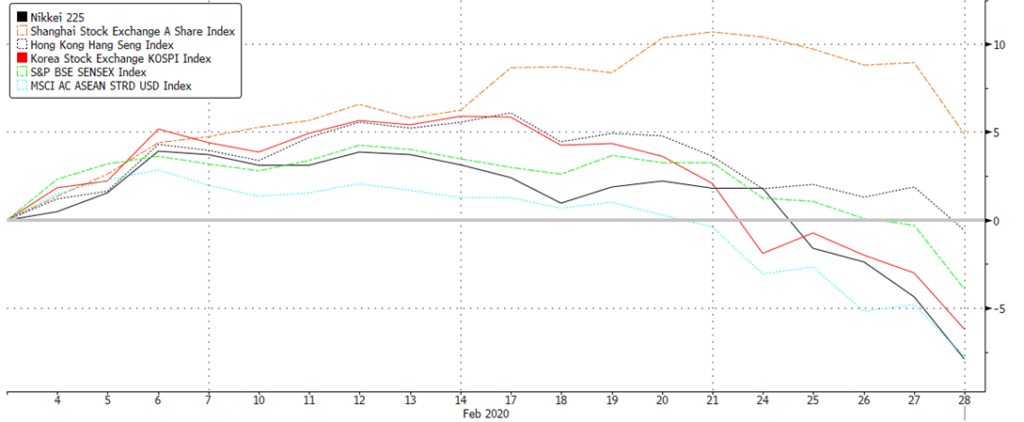
Figure 7: Performance of major Asian indices in Feb’20 Source: Bloomberg
On the macroeconomic front, China also unveiled a string of easing measures including interest rates loans, injecting liquidity via reverse repos, and targeted tax cuts to small firms and the private sector. The PBoC is also slated to offer CNY 500b of lending and discounts to funding to commercial lenders for loans to small companies and the agricultural sector. The moves come amid China’s latest factory PMI for Feb, which fell to an all-time low of 35.7 (vs est. 45). Overall, we saw an increasing number of countries introduce a slew of easing measures, most notably so in Southeast Asia.
FIXED INCOME
There was a clear shift to quality in Feb as fears around COVID-19 plagued markets. 10Y sovereign yields in developed markets mostly fell through Feb and into first few days of March (Fig 8).
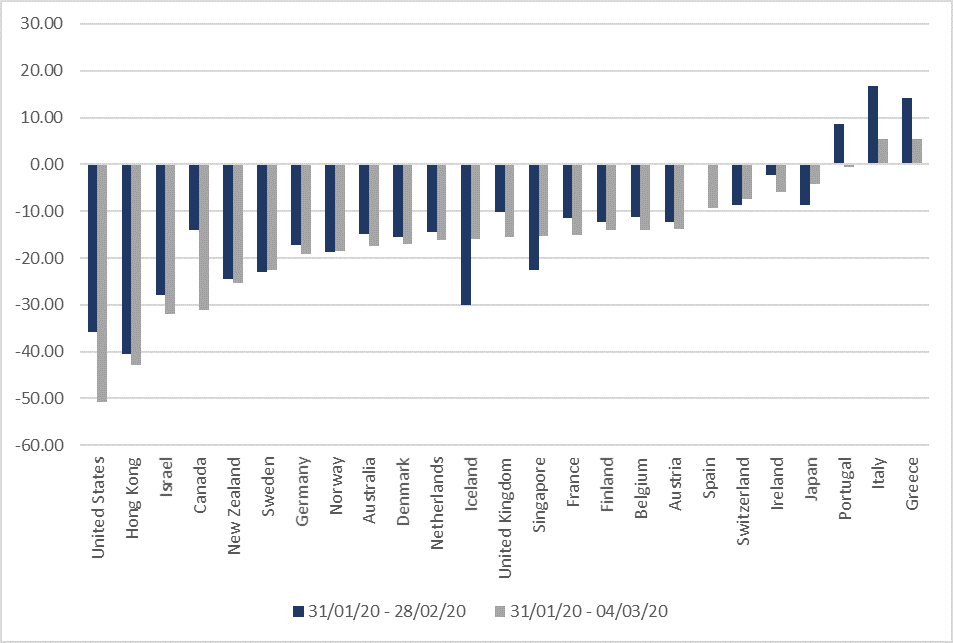
Figure 8: DM 10Y sovereign yields Source: Bloomberg
10Y UST yields led the decline, falling 36bps through Feb and a further 15bps in the first two trading days in March – a large part of it was caused by fears of a deeper Covid-19 outbreak. New cases and fatalities in the US, and in other countries outside China, led the FOMC to announce an emergency rate cut of 50bps on 3rd March. This led to the 10Y yield falling to a record low of 0.9043% intraday before easing higher to close 1.00% that same day (Fig 9). The 3M UST yield also fell to 0.70% at the close of 4th March – significantly below the Fed’s new policy rate range of 1% – 1.25%, while the 30Y yield fell to a record low of 1.61%. As of 3rd March, markets are pricing in an 84% probability of at least one more rate cut by YE20, and a 42% probability of at least two rate cuts.
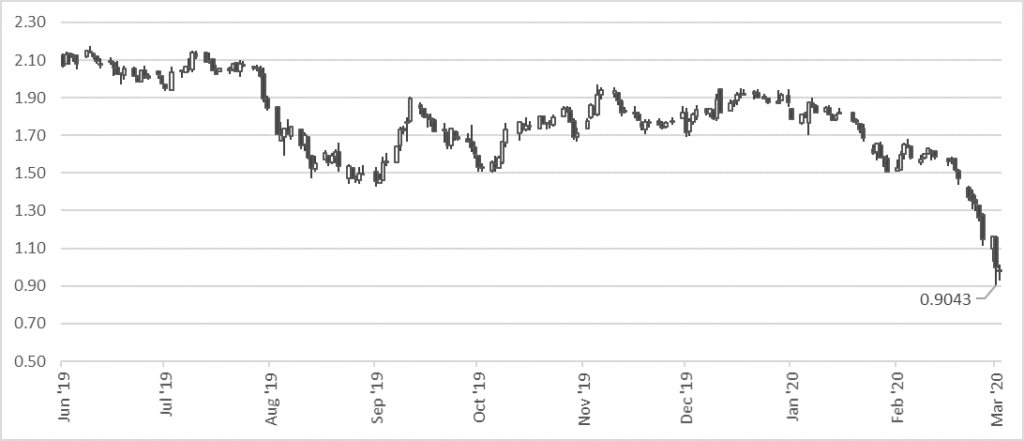
Figure 9: 10Y UST falls to record low intraday Source: Bloomberg
Over in Europe, sovereign yields were also pressured lower, especially in Italy after the number of reported Covid-19 cases in the country spiked up. After warning of the virus’ short-term impact on Europe’s economy, ECB Chief Economist Philip Lane said the new normal for ECB rates ranged somewhere between zero and 3% while Bank of Spain’s governor Pablo Hernandez de Cos said the bank should adopt an inflation target of 2%. Markets are also pricing in one cut by ECB in July. ECB president Lagarde downplayed the likelihood of ECB providing an immediate response to the outbreak earlier in Feb, but the Fed’s recent move might likely pressure the ECB into cutting, potentially sending rates further into negative territory.
The flight to safety was prevalent in the credit space too. The amount of inflows into IG was significant, thus capping the spread widening and leading the sector to outperform HY credit. Global and US IG index spreads were narrowing to their lowest in early ’18 before widening again towards the end of Feb when Covid-19 induced fears resurfaced (Fig 10). The spread widening was more significant in the HY, with global HY index spreads widening to levels last seen in ’16. This led to the spread between IG and HY widening too, with the BBB/BB spread moving form a record low 38bps to 150bps. Ultimately, the higher coupons in HY will offset the spread widening in the lower quality segment of the market but bottom up credit selection is important – we recommend avoiding certain sectors like Energy and Gaming, which might see significant impact in the near-term from the virus outbreak.

Figure 10: Global IG and HY spreads widden amid Covid-19 fears Source: Bloomberg
Issuance during the last week of Feb, especially in IG, also came to a standstill as companies held off in the face of the virus induced sell off (Fig 11). Technical indicators might be supportive of the asset class in general in the near-term as uncertainty around the severity of the Covid-19 outbreak. There is even an argument to buy credit now that spreads have widened significantly enough for there to be some insurance. In the longer term, rates are likely going to stay lower for longer with inflation unlikely to come back anytime soon.
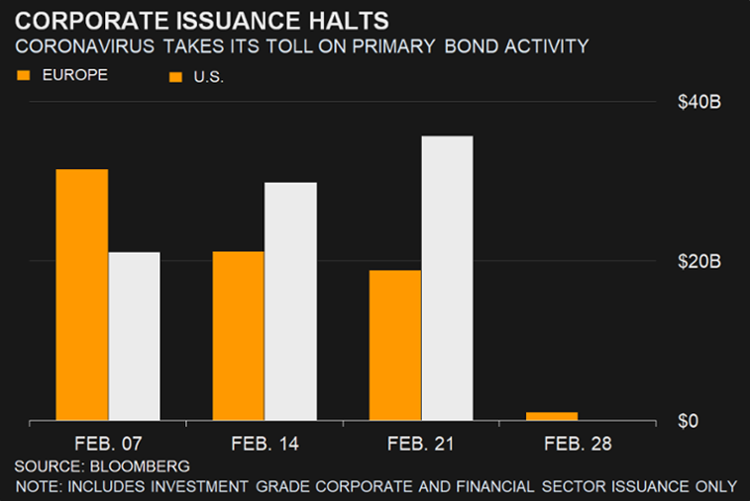
Figure 11: IG issuance comes to a standstill Source: Bloomberg
FX
This month saw FX volatility spike at its quickest pace since the Sino-US flareups – Asian currencies bore the full brunt of the damage earlier in the month as trade-related data in the APAC region fell at a record pace amidst concerns of an elongated disruption in the supply chain.
As the infection rate climbed in South Korea, Iran, Italy and Japan, risk-off sentiments continued to dampen markets causing once-favoured carry trades such as the IDR and INR to unwind. Investors then sought the JPY as a haven while the CNY remained resilient from its aggressive reflation (Fig 1).
Adding to our previous point, the Federal Reserve unexpectedly lowered interest rates by 50bps in the beginning of March, causing mixed reactions to the drastic move. This caused the dollar to reverse its gains, relieve the KRW’s pressure and further boosted JPY as it continued to pare its losses from 112.23 to 106.85.
We foresee weakness in the USD, and further weakness in the INR and IDR as we believe these countries remain at the highest risk due to its lack of infrastructure spending as well as population density.
We remain positive on CNH as we continue believe there is further room for the PBoC to reflate its economy and that markets have already priced in a much lower 1Q GDP reading. We also remain bullish on JPY and SGD as they stand to benefit the most from the Fed’s recent rate cut.
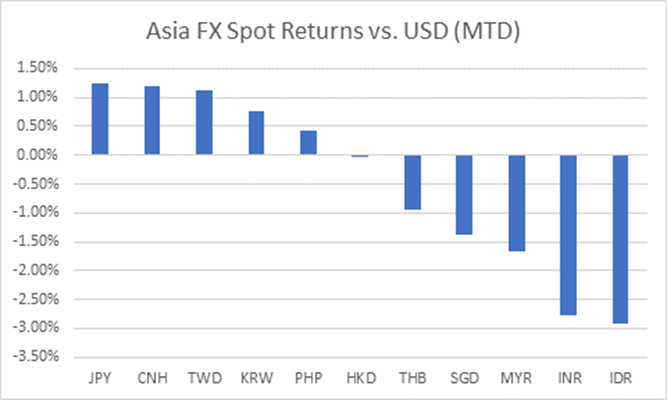
Figure 12: Asian currencies fell hard in Feb Source: Bloomberg
COMMODITIES
The Brent oil price continued its selling momentum from January as global growth continued to reel from the coronavirus. Oil fell a total of -15.60% and remained above its key support of $50. It ended the month at $52/barrel. Gold continued to gain from its haven attributes and touched a 7-year high of $1,689/oz.
Our view remains unchanged – a slowdown in global growth will continue to be the main headwind for Oil and as a catalyst for Gold. Automobile sales around the world has slowed down with China’s automobile purchases almost coming to a halt as a recent report from the PCA is showing car sales falling by over 80%.
We continue to believe that $50 is a strong support for Oil based on two factors; global reflation led by China and a supply cut from OPEC+ members in the near-distant future. Of the two factors mentioned, in the short term, we argue that Saudi Arabia’s proposal of a further 1.5-million-barrel cut remains unlikely. Our belief is that OPEC+’s rate of participation remains hard to quantify as investors are expecting a certain amount of reluctancy from Russia and Iran.
We continue to see limited upside for Gold for the same reason that Oil will see further upside; global reflation and markets being accustomed to the coronavirus’s rate of infection. We believe that the inflection point is located at $1,600/oz, a key support level for Gold. As the initial shock of the coronavirus is now over, we see Gold trading on fear and uncertainty rather than panic, seen by Gold since it rose from $1,480.