
May 26, 2021 | Articles, Global Markets Update
For Accredited Investors Only as defined in the Monetary Authority of Singapore Securities and Futures Act (Cap. 289) and its subsidiary legislation. For Professional Investors Only as defined in the Securities and Futures Ordinance (Cap 571, Laws of Hong Kong) and its subsidiary legislation. This advertisement has not been reviewed by the Monetary Authority of Singapore.
2023 Tourism Recovery Will Be Determined By Inoculation Rate
星野佳路 星野リゾート代表
新型コロナウイルス禍で観光旅行関連の消費はブレーキがかかった状態が続く。いつ、どのように回復するのか。必要な政策は何か。星野リゾート代表、星野佳路氏に聞いた。
――旅行・宿泊の需要をどう見ていますか。
「年4.8兆円あったインバウンドは蒸発したが、旅先を海外から国内に変えた日本人の需要3兆円が補っている。日々の予約は感染者が増えれば落ち、感染者が減れば持ち直す。足元は感染状況が悪化しても昨年ほど予約は落ちない。ワクチン登場が大きい。感染が落ち着けばGoToトラベルも再開するだろう」
「今後はワクチン接種のスピードにかかっている。ワクチン接種が進んだ米国や英国では行動制限解除を見越して旅行予約が回復している。日本でも接種が進めば上向くだろう。需要は2023年にはコロナ前の水準に戻るとみている」
――インバウンドは。
「東京オリンピック・パラリンピックをたとえ無観客でも安全に開催できれば意義は大きい。活躍する選手の姿、開催地の街の様子がテレビ中継で世界に伝わり、次は日本に旅行したいと思う人も増えるだろう」
「どの国も相手国の感染状況やワクチン接種の進捗を見ながら人の往来を元に戻していくプロセスが22年に本格化する。インバウンドは台湾、オーストラリア、中国、アメリカと徐々に戻ってくるのではないか」
――コロナ前に戻りますか。
「オンライン会議の定着で出張は減るかもしれないが、観光は成長軌道に戻る。マレーシア、インドネシア、中国などで増える中間層はコロナ禍が終息すれば海外観光旅行に動き出す」
「国内は変わる兆しがある。日本の観光産業の生産性が低いのは需要が休日に集中していたからだ。需要の波に対応するため雇用も75%が非正規だ。だがコロナ対策でテレワークやワーケーションが普及し、平日需要が増える可能性が出てきた。コロナ後も定着すれば地方の経済・雇用にとってプラスだ」
――必要な政策対応は。
「GoToトラベルの35%の補助率は下げるべきだ。コロナ終息で事業が終わる時に大幅値上げとなり反動減が大きくなる。補助対象はワクチン接種者としてワクチン接種を促進することも提案したい」
「何よりワクチン接種を早く進めて重症者を減らすことが重要。夏に経済が回復するには今後1カ月が勝負どころだ。先行するイスラエルや米欧各国は接種者の行動制限を緩めるインセンティブがある。政策を組み合わせて一気に接種率を上げるべきだ」
――星野リゾートはどう取り組みますか。
「需要が冷えた都市部でホテル運営を投資家から任される案件が増えている。供給過剰の市場で経営を立て直すのはバブル崩壊後に経験を積んでいる」
「ホテル運営企業として世界で認められるため北米には進出したい。日本の付加価値を提供できる温泉旅館をやる。80年代に米国でホテルを買収した日本企業が失敗したのは西洋ホテルをまねたからだと思う」
(聞き手は編集委員 吉田ありさ)
ほしの・よしはる 米コーネル大ホテル経営大学院を修了後、91年に家業の4代目代表に。60歳
Yoshiharu Hoshino, Representative of Hoshino Resorts
Sight seeing travel-related consumption will continue to slow down due to the new coronavirus disease. When and how will you recover? What is the required policy? We asked Mr. Yoshiharu Hoshino, the representative of Hoshino Resorts.
――How do you see the demand for travel and accommodation?
“Inbound, which was 4.8 trillion yen a year, is eliminated but the demand of 3 trillion yen for Japanese who have changed their travel destination from overseas to domestic is supplemented.
Daily reservations will drop if there is an increase in infection, and will recover if the number of infected people decreases. Even if the infection situation worsens, reservations will not drop as much as last year. Vaccines are coming out. If the situation in Japan recovers, we believe Go To Travel will resume. “
“From now on, it depends on the speed of vaccination. In the United States and the United Kingdom, where vaccination has progressed, travel reservations are recovering in anticipation of lifting restrictions on behavior. In Japan, if vaccination progresses, demand will increase in 2023 and is expected to return to pre-corona levels. “
–What about inbound?
“It would be significant if the Tokyo Olympics and Paralympics could be held safely even without spectators. The appearance of active athletes and the state of the venue city will be broadcast to the world on TV, and more people will want to travel to Japan next time.”
――Would you like to go back to Corona?
“The establishment of online conferences may reduce business trips, but tourism will return to a growth trajectory. The growing middle class in Malaysia, Indonesia, China, etc. will start overseas tourism once the coronavirus situation is over.”
“There are signs that the country will change. The productivity of the Japanese tourism industry is low because demand was concentrated on holidays. 75% of employment is non-regular to respond to the wave of demand. With the spread of industry, there is a possibility that demand will increase on weekdays. If it becomes established after Corona, it will be positive for the local economy and employment. “
–What is the necessary policy response?
“GoTo Travel’s 35% subsidy rate should be lowered. When the business ends at the end of the corona, the price will rise significantly and the reactionary decline will be large. I would also like to propose that the subsidy promote mass vaccination”
“Above all, it is important to accelerate vaccination and reduce the number of seriously ill people. The next month will be the game for the economy to recover in the summer. Leading Israeli countries and the US and European countries have incentives to relax the restrictions on the behavior of vaccinated people. . We should combine policies to raise the inoculation rate at once. “
――How will Hoshino Resorts work?
“Investors are increasingly entrusted with hotel operations in urban areas where demand is low. Rebuilding operations in oversupplied markets has been important after the collapse of the bubble.”
“I want to expand into North America because it is recognized as a hotel management company in the world. I will do a hot spring inn that can provide added value to Japan. The Japanese company that acquired the hotel in the United States in the 1980s failed because it imitated a Western hotel. I think”
(Interviewer is Arisa Yoshida, editorial board member)
Hoshino Yoshiharu became the fourth representative of the family business in 1991 after graduating from Cornell University Hotel Management Graduate School. 60 years old

May 11, 2021 | Articles, Global Markets Update
For Accredited Investors Only as defined in the Monetary Authority of Singapore Securities and Futures Act (Cap. 289) and its subsidiary legislation. For Professional Investors Only as defined in the Securities and Futures Ordinance (Cap 571, Laws of Hong Kong) and its subsidiary legislation. This advertisement has not been reviewed by the Monetary Authority of Singapore.
Death and Taxes
Investors in the Asian time zone may not have noticed the that on the 4th of May, the Nasdaq fell by -2.8% at its trough before regaining half of its losses by session close. Maximum losses MTD has been as high -3.8%. The main reason for market skittishness has been the funding for Biden’s two proposed stimulus programs, the USD2.3tn American Jobs Plan (infrastructure upgrade) and the USD1.8tn American Families Plan. The funding for these programs will affect two primary drivers of equity returns, corporate profit growth and tax treatment for capital gains.
The payment for these programs includes USD2tn from higher corporate taxes, a proposed hike to 28% from the current 21%, and USD1.5tn from raising the top capital gains tax to 39.6% from 20%. The latter only applies to individuals earning more than USD450,000 or couples earning more than USD500,000 (the 1%’ers). Already, there are reports that Biden may be willing to consider a 25% corporate tax rate, so there will likely be numerous iterations of the actual amounts. In the case of the impact of taxable income, this accounts for approximately 30% of the investment in US stocks, and while the proportion impacted will be far less, the 4th of May price action indicates the market impact could be significant. One of the most beneficial policies that is less controversial is the USD50bn proposal to improve tax collection for which estimates of additional tax collected range from USD700bn to USD1tn.
While the long-term economic impact of these programs will take many years to discern, the debate of these programs during a seasonal period of lower liquidity could lead to bouts of volatility. The obvious sectors that may be adversely affected are those that benefitted most from the Trump tax cuts, technology, communication services and health care. Industrial, energy and materials benefitted the least. Further, the NASDAQ is up 40% from the pre-COVID peak and is up 100% from the COVID trough in March, and profit taking could be a periodic headwind.
Rising Prices
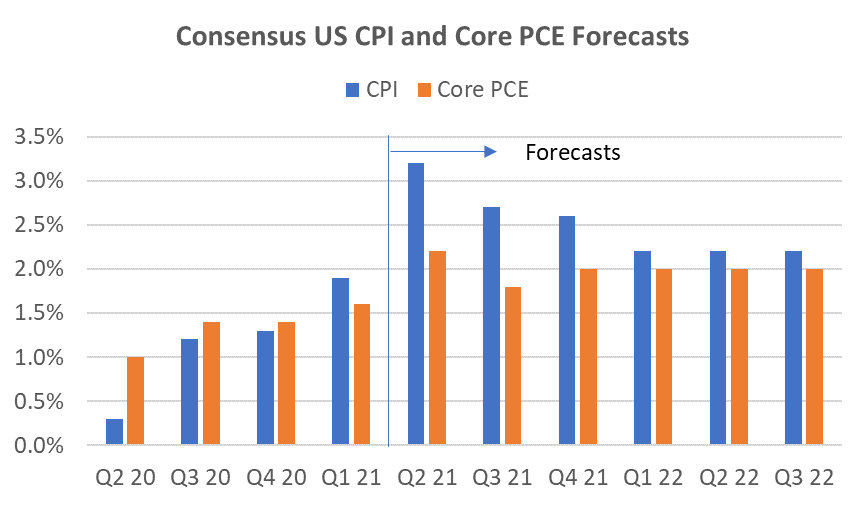
The SPGS Commodity Index rose +8.2% in April and is up +23% YTD. Together with a slew of reports from companies such as Coca-Cola, Whirlpool, Proctor & Gamble, and even Berkshire Hathaway, that prices are rising sharply and being accepted, investors should be prepared higher headline US inflation numbers in the next two quarters. This is expected. Inflation rises during an economic recovery. The unknowns are how high inflation may rise, and importantly, how much is considered transient. So far, the Fed appears unperturbed and the 10Y UST yield appears to have lost momentum since its March peak. Consensus forecasts for Q2 2021 US CPI is now at 3.2% and has been rising steadily since mid-2020. We should not be overly surprised of a monthly number close to 4%. This quarter is expected to be the peak, with CPI gradually declining for the remaining 2021 quarters. A CPI number significantly higher than 4% or a CPI that does not begin to decline after this quarter may cause concerns.
Source: Bloomberg
Earnings Growth Still Very Strong
The key driver of equity returns, EPS growth, remains very robust. For the US, 87% of S&P500 companies beat EPS estimates by 24% and top line growth surprised by 4%. Discretionary and Financials led the pack. For the Stoxx600, 72% beat EPS by 18% and revenue growth surprised by 7%. Strong EPS outperformance is generally positive for the markets, however, the impact has been subdued in the latest quarter (see chart below). The reasons for this are likely to be many but the crux can be alluded to a sell on the fact mentality. Technicals, valuations, strong YTD performance potential tax increases likely all played a role. Nevertheless, strong earnings indicate this remains more a buy on dips market than a sell on dips.

Source: JP Morgan
Is there a potential for a lull in growth in the US as we have seen in other regions, most notably in China? This is certainly a risk, and higher inflation may exacerbate the impact to corporate profits that will have flow-on affects for markets. However, progress on approving stimulus programs may mitigate the impact of any short-term lull in growth that the most recent jobs claims data might indicate.
Investment Recommendations
Back to the Pack But for How Long?
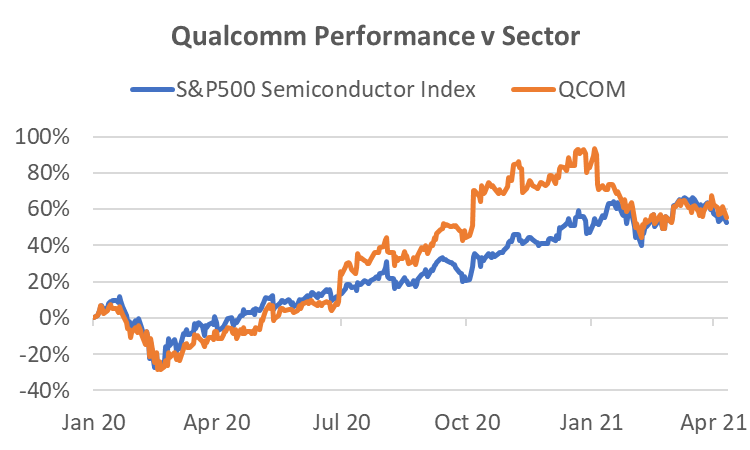
This month we highlight two stocks that were market darlings last year but have faced a few headwinds recently. These two stocks are Qualcomm (QCOM) and Eli Lilly (LLY). In 2020 these stocks were considered best in class exposures for 5G and Pharmaceuticals respectively and returned 73% and 28% for the year. This year QCOM is down -10% YTD and in March 2021, LLY fell -9%.
QCOM has suffered from 3 main concerns; 1) component shortages, 2) weaker sell-through 3) Apple Inc. deciding to take the wireless modem business in-house. The latter accounts for around 20% of QCOM’s revenues. However, the latest quarterly result showed that 1) & 2) have been well managed through optimizing product mix, solid execution, and increasing opportunities in China from loss of market share by Huawei. Further, despite the gradual loss of the Apple business, consensus revenue growth for the firm is 49% over the next two years and EPS growth is expected to surge by 155%. The 5G story has not changed and the pullback brings the stock to more attractive valuations.
Source: Bloomberg, Odyssey
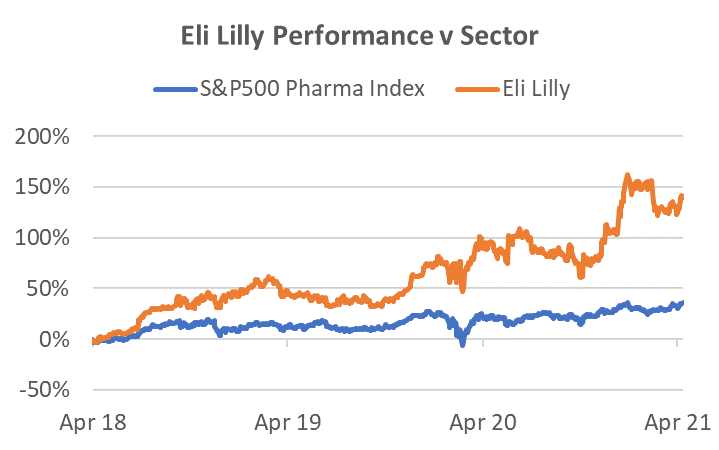
LLY has had the strongest pipeline among the large pharmaceuticals for several years. One of the most exciting developments has been LLY’s drug for the treatment of Alzheimer’s, Donanemab. In the US, 4.5mn people suffer from early-stage Alzheimer’s so the potential of the drug is huge. In January, an initial Phase 2 trials showed promising results which catapulted the market cap of the stock by USD19bn. However, in March a more extensive Phase 2 trial showed mixed results – the drug cleared substantial amounts of amyloid plaques in the brains of treated patients. But outcomes in secondary trial goals — measures of cognition, memory, and activities of daily living — were more mixed and further study recommended. The result caused the January gains to be wiped out as concerns grew about the efficacy of the drug. These are only Phase 2 trials and a more comprehensive test (results expected in June) is being conducted in preparation for Phase 3 trials later this year. While the results have been mixed relative to the high expectations developed in January, the drug appears at least as effective as its main rival, Aducanumab, produced by Biogen. Hence, the potential remains for this drug to become a blockbuster and highly profitable.
Regardless of Donanemab’s future success, LLY recorded 16% revenue growth in Q1 2021, backed by a strong portfolio in neuroscience, diabetes, oncology and immunology. While the Pharmaceuticals sub-Index has trailed the S&P500 at +6% YTD, should we see a continuance of recent uncertainty over the next quarter, the defensive nature of the industry could lead to outperformance. We continue to see LLY leading the pack as it has over the lasts 5 years with a price gain of 139%, almost 4x the sector return.
Source: Bloomberg, Odyssey
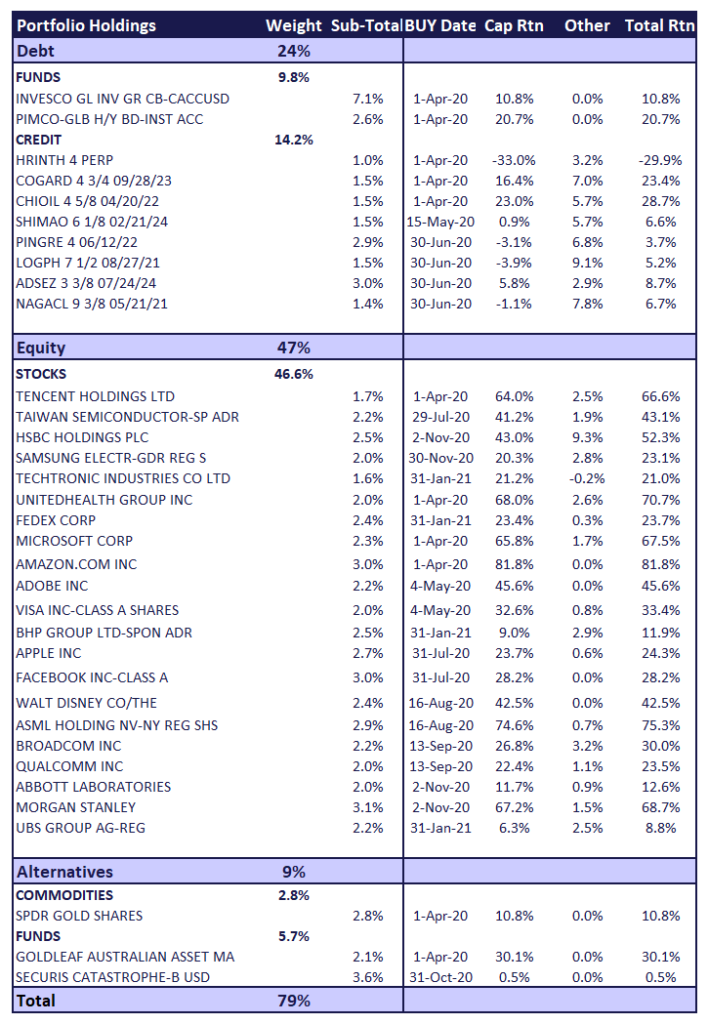
Odyssey Model Portfolio Performance

If you like to receive more information on our portfolio solutions, please contact us here: info@odyssey-grp.com.

Apr 9, 2021 | Articles, Global Markets Update
For Accredited Investors Only as defined in the Monetary Authority of Singapore Securities and Futures Act (Cap. 289) and its subsidiary legislation. For Professional Investors Only as defined in the Securities and Futures Ordinance (Cap 571, Laws of Hong Kong) and its subsidiary legislation. This advertisement has not been reviewed by the Monetary Authority of Singapore.
April 2021 Insight
All Roads Lead to New York
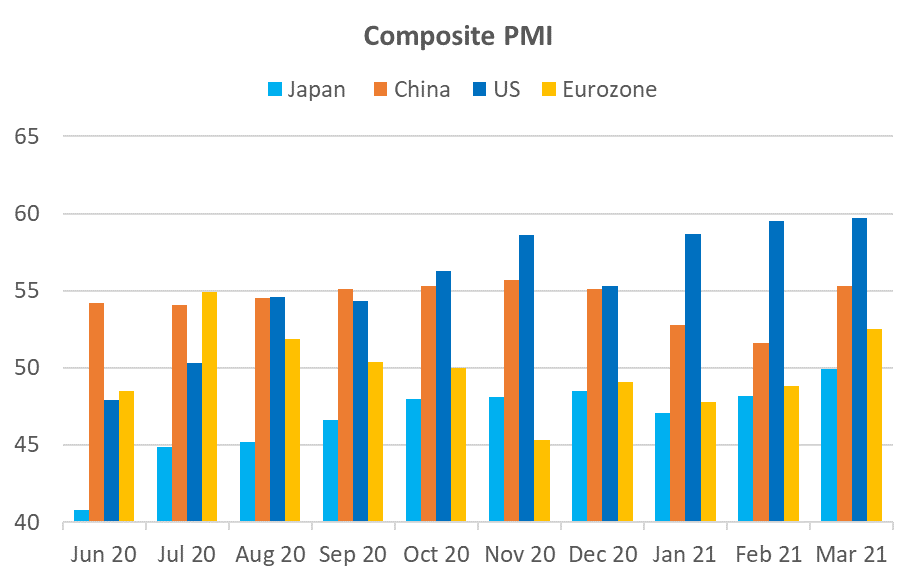
The first quarter produced solid returns for risk investors overall but proved to be tricky for tech stock investors, small-cap speculators, and long-duration bondholders. A major reason was the rise in long-end yields which questioned the valuation of growth stocks under the glare of potential inflation. The flip side of this argument is that the caution around inflation has been inspired by the rapid recovery in economic growth, particularly in the US. Unlike other regions where the economy faltered in January and February, US PMI has been consistently strong in Q1, underscored by Non-farm payrolls surging to 916,000 in March, 250,000 ahead of consensus. Gains were led by leisure, hospitality, and construction – sectors that had been hit the hardest during COVID.
A potential game-changer is President Biden following up a USD1.9tn relief bill with a massive USD2tn plan to reinvigorate US infrastructure. No doubt the plan will go through several iterations before approval, but despite Republican aversion to taxes, conceptually it should gain bipartisan support. Even spread out over 8 years, this would be a long-term fillip for the economy. As Jamie Dimon wrote in his 2021 letter to JPMorgan shareholders “the economy will likely boom”. Given the strength in the US economy, the potential for further stimulus, and the superior speed of the vaccine rollout (as of April 7, 64mn Americans had been vaccinated), it remains our most favoured investment destination.
Source: Bloomberg
Possible Speed Humps
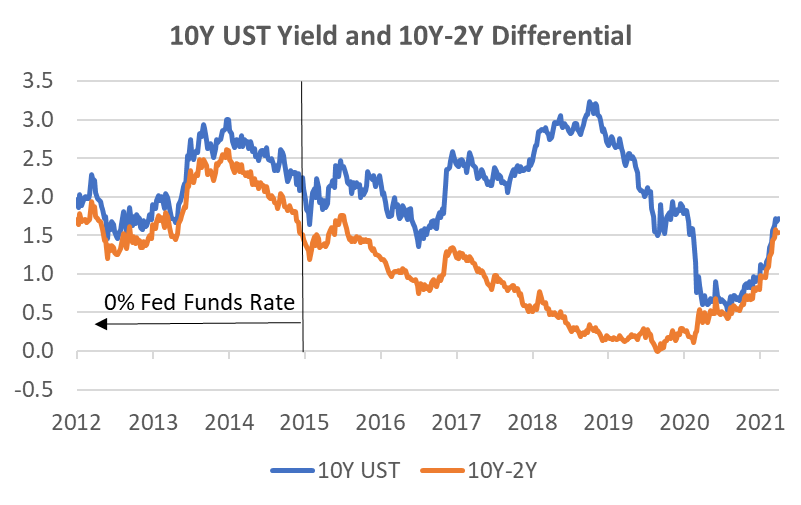
There are two short-term caveats to our optimistic view on the US. The first is that the long end of the rate curve is likely to continue to rise as the economy strengthens. While the momentum appears to have subsided for now, the absolute level of the UST10Y, as well as the UST10Y-2Y yield differential, remains well below levels in the last decade during “normal” economic conditions, even when the target rate was anchored to zero. Any rapid rise in long-end rates would likely again represent a headwind for growth stocks.
Source: Bloomberg, Odyssey
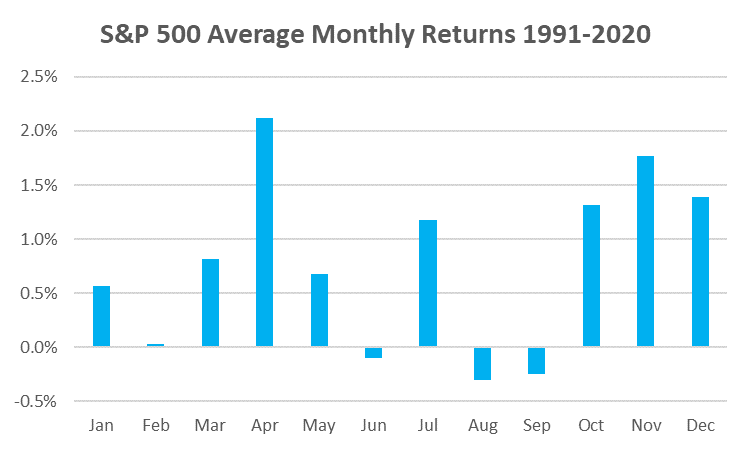
The second potential short-term headwind is one we face every year. The statistical “Sell in May …” is real, although with statistics we are talking about an average number. In the last 30 years, the May-Sep period returned +1.3% on average and was positive 70% of the time. In comparison, the Oct-Apr period returned +8.4% and was positive 83% of the time. There were actually 5 months with worse average returns than May which returned +0.7%. April, November, and December were the best-performing months. The other noteworthy feature is that the standard deviation for monthly averages was uniformly high at circa 4%. Since the level of dispersion is twice the highest average monthly return, making generalisations can be quite risky.
While these types of statistics should not be relied upon, it does show that, as long as the fundamentals are positive, the May-Sep period can be a profitable one. It’s just that the risk-reward is generally not as good as during the Oct-Apr period.
Source: Bloomberg, Odyssey
Some Respite for Income Investors?
After a strong 2020 when investment grade (IG) credits benefitted from both falling rate yields as well as recovery in spreads from April onwards, 2021 has been a different story. The Bloomberg Barclays Global Credit Index has returned -3.5% YTD. With a lower duration and a 2.75% higher yield, the Global HY Index has fared better with a 1.1% return. The main driver of credit returns this year has been long-end rates. With credit spreads remaining close to all-time tight levels, future returns are likely to continue to be at the mercy of long-end rate movements.
One liquid yield play that has performed well despite rate movements has been REITs. While REIT prices have traditionally shown a negative correlation to the direction of yield movements, recent upward grinding moves of the sector have been due to the recovery in the price to book ratio (PBR) that fell 37% in Feb-Mar 2020. Now that the PBR has recovered close to its 5Y peak at 2.4x, but the estimated dividend yield has fallen to just 3.1% compared to its usual 3.5-4.5% range, the upside may now be more limited. We say “may” because the market cap of many recovery stocks is now higher than where they were pre-COVID, even adjusting for a “normal” operating environment.
Investment Recommendations
Laggard Recovery Plays
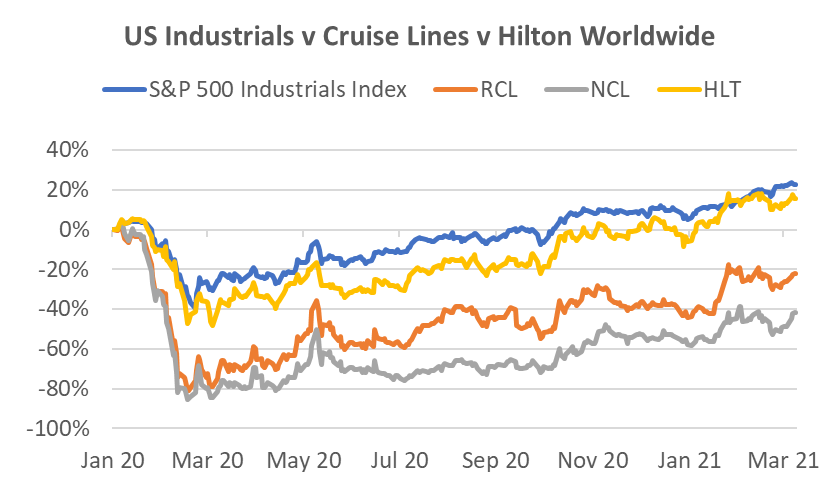
The Industrials sector is an obvious recovery play. While the Industrials sector is full of cyclical stocks, in many cases the market has already valued a full recovery despite current difficult trading conditions. Indeed, the US Industrials Index is now 18% higher than the pre-COVID peak and performance only lags the S&P 500 Index by 3%.
One industrial sector that has lagged, but has recently received highly positive news, are cruise lines. On April 7 the US CDC has stated US cruises could resume by mid-summer. Norwegian Cruise Lines (NCL) has already stated it plans to start cruises from US ports on July 4 with fully vaccinated guests. Bookings for H2 2021 have been accelerating in recent weeks and prices have been more resilient than expected. While H2 2021 bookings are still shy of 2019, 2022 bookings are well ahead of 2019 due to very strong pent-up demand. With better guidance in respect to re-openings, the share prices of listed hotel chains such as Hilton and Marriott are already back to, or above, the pre-COVID peaks whereas NCL and Royal Caribbean Lines (RCL) remain circa 40% and 20% respectively below their peaks. For NCL, we like their smaller, more modern fleet that appears at an advantage in the post-COVID environment, and RCL is the premium brand in the sector, a factor we rarely ignore in an early upswing cycle. These stocks can be more volatile than the mega-cap we usually recommend and should be sized accordingly.
Source: Bloomberg, Odyssey
Social Media is All About the Camera
We’ve been encouraged by our recent positive calls on Facebook and Google. Another we have liked since their blockbuster Q4 result is Snap Inc (SNAP). The stock then fell 30% due to rising rates but has since begun to climb back up. It’s not a cheap stock on traditional measures but management’s recent rare claim that they believe revenues can potentially grow by 50% for several years means short-term valuations do not capture the embedded value in the business. For instance, Snap’s ARPU is currently less than 10% of Facebook’s. That’s a lot of upside for a company that is widely acknowledged as one of the most innovative among social media platforms, thereby maintaining its “lit” status among the young. Many of Facebook’s features appear after Snap first introduces it on their platform and this is likely to continue. Indeed, Snap is now designing products it says are more difficult to replicate and many of these revolve around the phone camera. In addition, they are doubling down on what they believe is the next evolution in computing, augmented reality (AR). Revenue growth of 62% in Q4 2020 demonstrates its leverage to the recovery in ad spending, but it also underscores the structural growth story of harnessing social media among a younger audience.
Odyssey Model Portfolio Performance

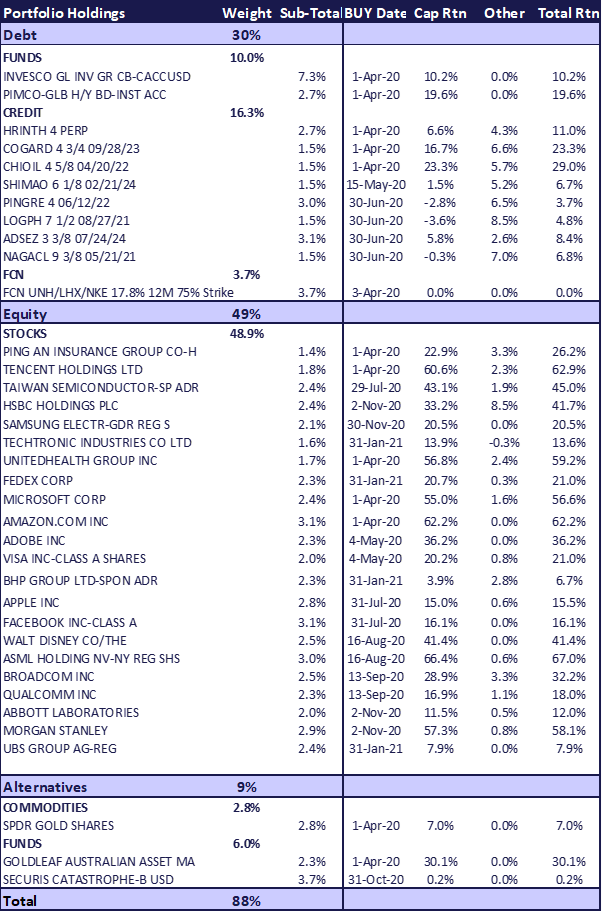
Horizon Performance

If you like to receive more information on our portfolio solutions, please contact us here: info@odyssey-grp.com.

Mar 10, 2021 | Articles, Global Markets Update
March 2021 Insight
Inflation is a Dirty Word
If there was one factor that could knock the rally in risk assets on its head is the specter of inflation. That would remove the easy money that has been fueling markets. Right now, it is just the speculation of inflation as indicated by moves in the 5Y treasuries and beyond. Certainly, we have seen some positive inflation in recent data, and that’s a good thing. If we didn’t, it would mean the global economy was not recovering and the markets would have something far worse to contemplate. Indeed, if the recovery accelerates with the distribution of vaccines, headline inflation (CPI) may well surpass the often quoted 2% target in the next couple of quarters term due to low comparisons in Q2 2020 when US CPI fell close to zero. Further, the World Commodity Index has surged 63% since April 2020, which represents large rises in energy and raw material prices.
While headline inflation may cause concern for markets, most governments base monetary policy on some form of core inflation that often excludes food and energy prices. The US Fed favours the Core Personal Consumption Expenditure (PCE) Index as one its measures and this has not been above 2.5% since 1993. Indeed, there has been a falling trend in the PCE over the last 50 years and this unsurprisingly has coincided with the fall in unit labor costs per real GDP. The only time it has sustained above 2% for any length of time in the last 25 years was during the credit bubble of 2004-2008 when it was continually just above 2%. What has been driving this disinflation? My own opinion is that the root cause is accelerating technology adoption and diminishing wage growth due to an ageing working population. In 1999, workers of age 55+ were just 12.7% of the workforce. By 2019 this had almost doubled to 23.4% and by 2029 the U.S. Bureau of Labor Statistics forecast this age group to comprise 25.2% of the workforce.
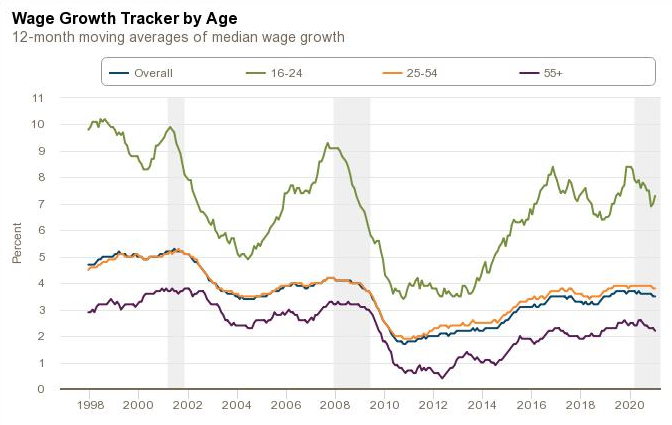
Source: Federal Reserve Bank of Atlanta
Since I am expecting these root forces to continue, it is not expected that the PCE Index to sustain above 2% for an extended time. From the Fed’s dovish comments, we appear to agree. However, the US yield curve is pricing in a rate hike as early as 2023 which is obviously earlier than the Fed’s expectation. Apart from jaw-boning, there is little the Fed can do to affect pricing several years beyond the target rate. The current 2Y-10Y differential is at 1.45%, above the previous spike of 1.34% in December 2016 and close to a potential resistance at 1.5%. Prior to that we had spikes to 1.76% in June 2015 and 2.61% in December 2013. In terms of absolute level of the 10Y UST, the 1.59% yield is similar to that in 2016 and 2012.
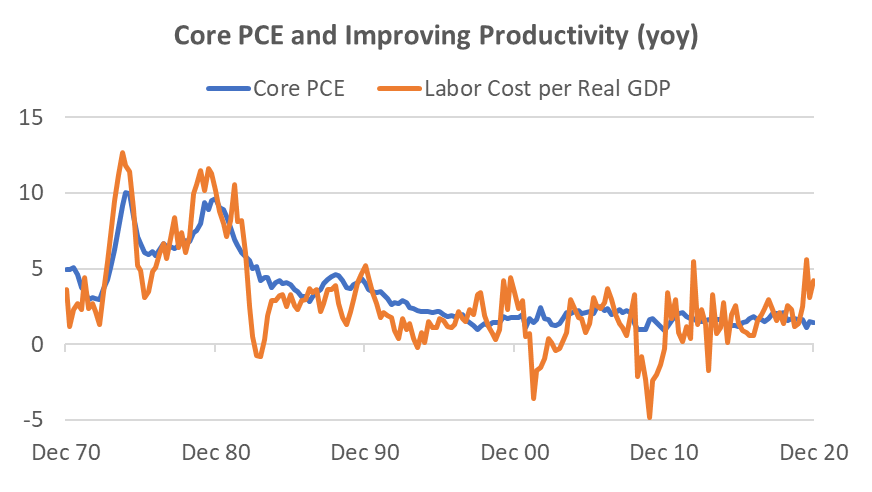
Source: Bloomberg
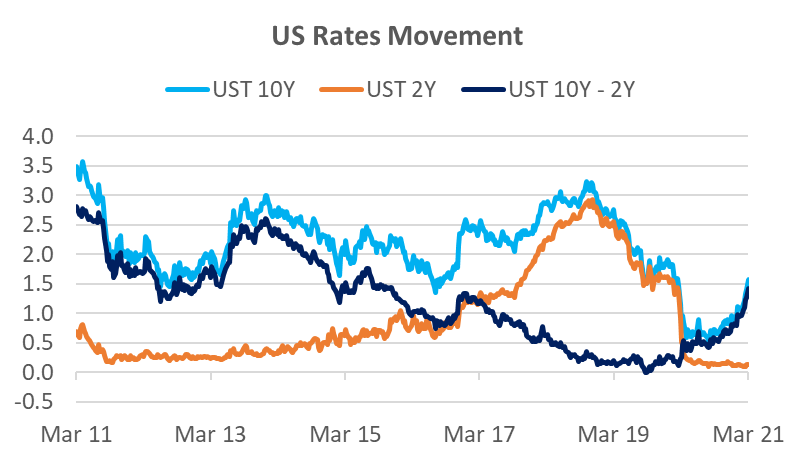
Source: Bloomberg, Odyssey
The Pain Trade in Rates
Several generations of bond traders have made fortunes from being long bonds – making money from when bond yields fall. That is because this has been the trend for three decades. Few traders like to short bonds, because they are betting against the trend. In addition to the specter of inflation, rising bond yields can have significant momentum for a time; everyone is betting in one direction and with significant leverage (often 10x or more). As the bond yields rise and prices fall, it becomes a pain trade for bond traders, and it ends up being a scramble to close out their long positions. The other marginal large player in rates are the large CTA (commodity trading advisors) funds that are followers of directional trends. Commentary suggest they close out their long bond positions in January and started to build up short positions in February. Trend algorithms do not have a human trader’s reticence or care about fundamentals.
Usually when bond yields rise, bond traders have an inkling that either inflation is rising faster than expected or that the government is about to alter monetary policy. In this case, we have only glimpsed the barest evidence of inflation and the Fed has been steadfast in its monetary policy. This is a reason why the bond market and equity investors have been caught a little off-guard, and probably why yields have been higher than what might be expected from fundamentals. Are yields heading even higher? Since the answer appears more technical rather than fundamental, then the short answer is that it is certainly possible.
Dealing with Adjustment Pains
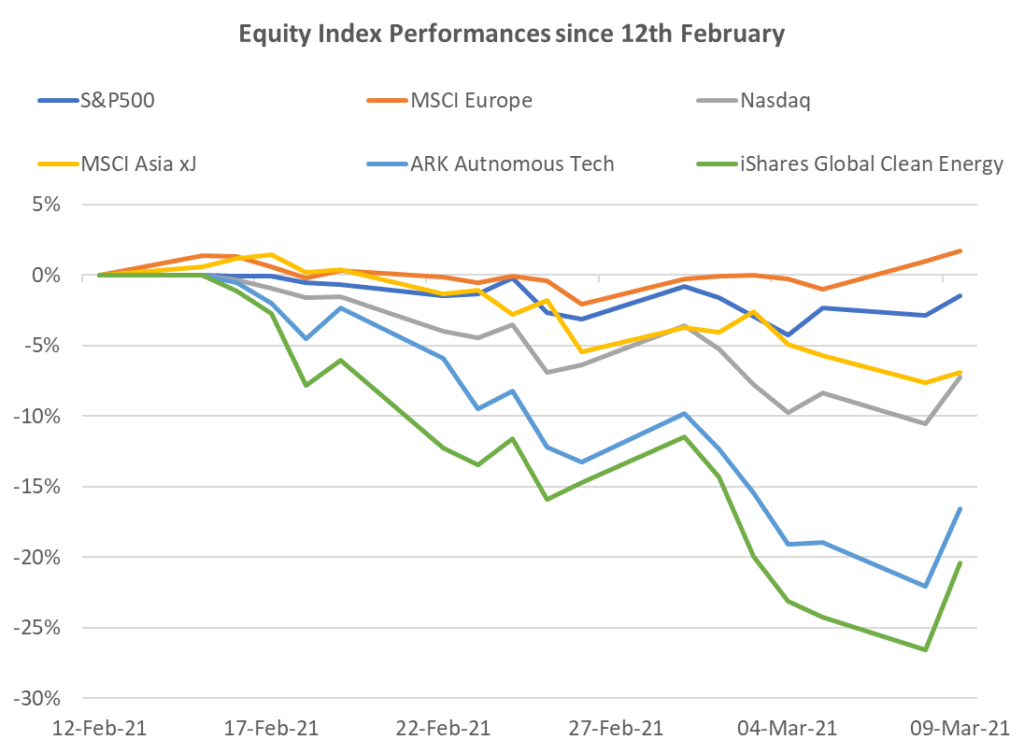
It is not helpful when a market commentator says that the current clearing out in stocks is good for medium and long-term returns when you are losing money. The good news is that blue-chip stocks have been highly resilient. The S&P500 is down less than 3% from its peak and major European burses have hardly moved. In fact, US Value stocks continued to climb another 3% since the S&P500 peak and Banks are up +9%. It’s been the high growth and speculative stocks that have suffered. The Nasdaq has fallen 10% and MSCI China has fallen 16%. Speculative ETFs have fallen 20-30%. In terms of technicals, it’s worth noting that the Nasdaq has hit it’s 100-day moving average. However, the trend of the UST 10Y is likely to remain a major factor.
Source: Bloomberg, Odyssey
Mixed Bag in Other Markets
We have been warning about the temptation to buy long duration credit for yield since November last year. The Global Corporate Credit Index is down -4% YTD and US Investment Grade is down -5%. Global HY is largely flat YTD due to lower duration and assisted by a higher carry.
The one asset class that has unequivocally benefitted from the stronger economic outlook has been commodities. The London Metals Index is up +9% YTD, with copper up +14%. WTI Oil is +14% YTD and has moved in virtually a straight line up since the beginning of the year. The main commodity to suffer has been gold which is down -7% YTD and has lost some of its lustre due to the popularity of cryptocurrencies.
Investment Recommendations
When Boring is Good
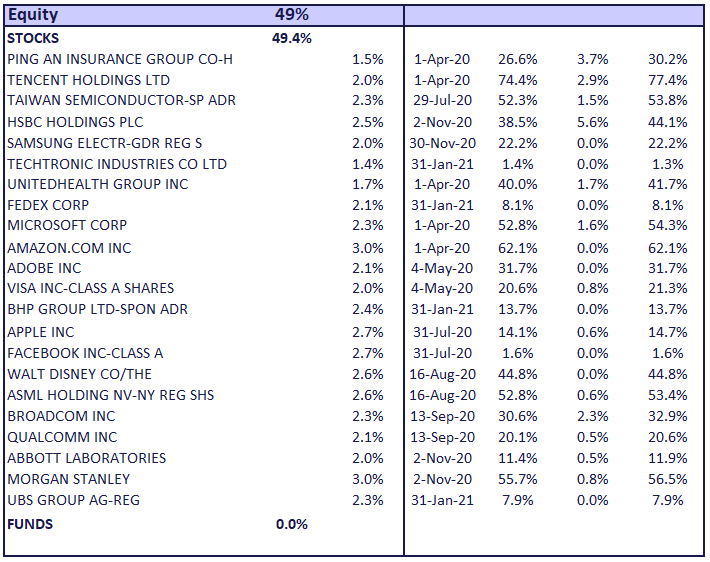
Back in November 2020 when the Value v Growth issue in stocks first arose, we chose a slightly different tact. We suggested a 3 stock basket that was non-tech and seemed to perform in a steady fashion regardless of whether Value or Growth was favoured. The basket comprised UnitedHealth, Abbott Labs and Morgan Stanley. Since the end of November, the basket is up +14% and up +2% since the recent peak of the SPX500 on February 12. These have not been flashy stocks but together they would have helped to stabilize any equity portfolio and provided significantly better than market returns. All three have announced solid Q4 operational results and we have no qualms about continuing to recommend these stocks, particularly as a basket.
Value in Tech Yet?
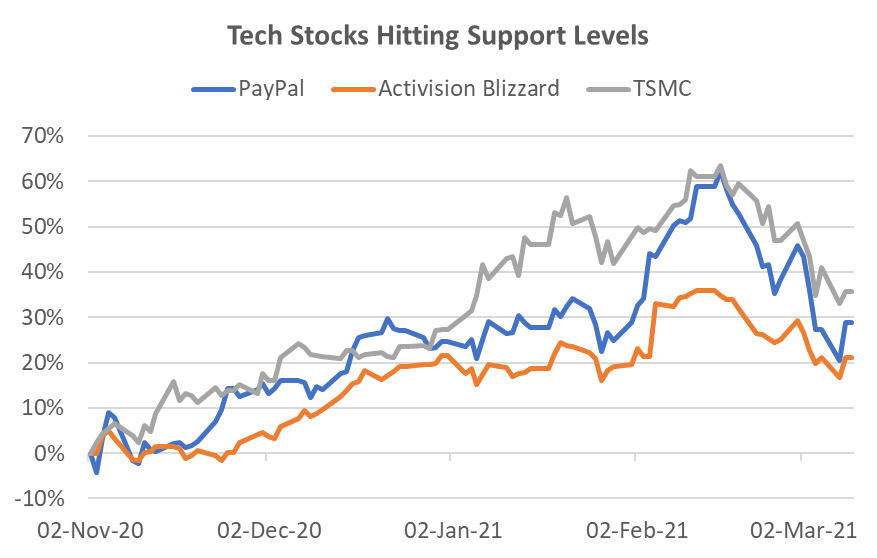
Despite the recent 10% fall in the US Infotech sector, the 1-year forward PER at 30x remains 40% higher than the 10-year average at 21x. Some of this is due to the 41% weight to Apple and Microsoft, but there is no denying the sector remains expensive. Nevertheless, the US Infotech sector has hit the 100-day moving average and if we can get some respite from rising rates, the potential for a technical bounce is possible. There are plenty of stocks that we have previously recommended that had very strong Q4 results but have fallen 20-25% to what appears to be technical support levels. These include Paypal, Activision Blizzard, and TSMC to name just three. However, to find one that is trading close to pre-COVID valuations is more difficult.
Source: Bloomberg, Odyssey
One such stock is Google. We rarely featured this FAANMG last year because its peers were overshadowing its performance, but the last two quarters have seen a marked operational improvement to firmly catch up with its peers. It has been a major beneficiary of the recovery in online advertising spend, but it is not burdened with as many political and sentiment issues as Facebook. In particular, its Youtube business has been riding a wave of popularity, and with a new product suite, the 45% revenue growth in Q4 2020 is expected to remain strong. Further, while Amazon and Microsoft continue to dominate cloud infrastructure, Google Cloud’s large customer acquisition program has started to improve, demonstrated by 46% revenue growth. Finally, Search remained a very solid performer with 17% revenue growth. At a valuation of 29x 2021 earnings, the stock is trading only slightly high to its usual range of 25-30x over the last 5 years. The stock has shown resilience during the growth sell-off and has only fallen 4% from market peak to trough.
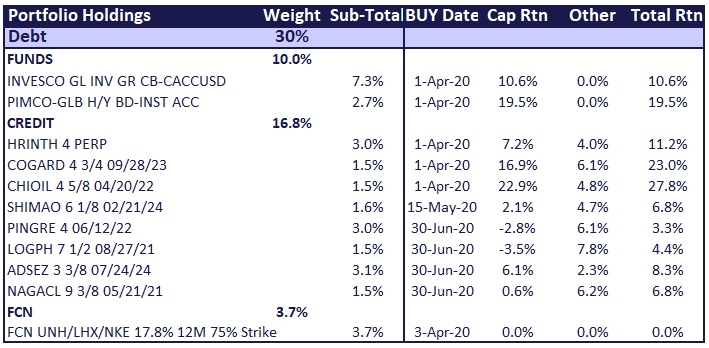
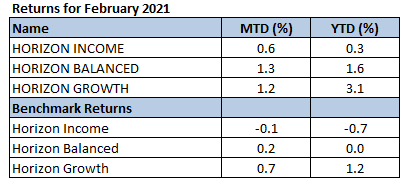
Odyssey Model Portfolio Performance


Horizon Performance
If you like to receive more information on our portfolios solutions, please contact us here: info@odyssey-grp.com.

Feb 10, 2021 | Articles, Global Markets Update
February Market View
Wall Street meets Social Media
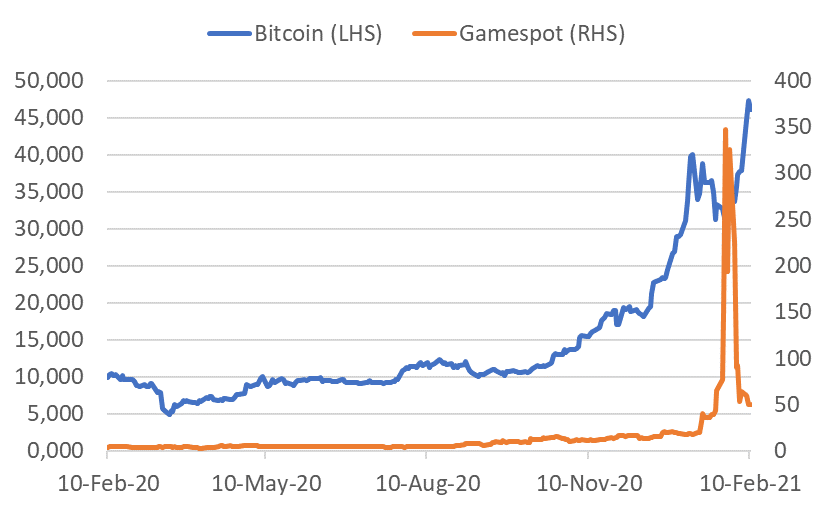
The evolution of social media has turned into a revolution for the financial markets. Ten years ago, the mostly forgotten Arab Spring showed how nascent social media could galvanise the populace to cause social and political change. More recently we’ve seen social media propel the #MeToo movement, Donald Trump tweeting over 26,000 times as the POTUS and often using it to announce official news, Russia being accused of using social media to affect the 2016 US elections, as well as being used in the recent protest on Capital Hill. Now the financial markets are experiencing how effective social media can be in moving asset prices.
Chart: Bitcoin and Gamespot price
Source: Bloomberg
Dramatic price moves have occurred in Gamestop, AMC, and now Bitcoin through actions on social media. What does the increase in the use of social media platforms bode for investing? The use of social media for investment research has been prevalent for close to a decade. The rise of the “retail” or DIY investor can be seen by the massive growth fund flow to ETFs at the expense of the active manager. In recent months, the move has also transferred to individual stocks and stock options and this has been cited as a major reason behind the rally since November.
Chart: Net Call Option buys with less than 10 contracts on individual equities

Source: J.P. Morgan
The strength of the retail buying may be a major factor in market direction, at least in the short term. However, for most of us, monitoring retail flows may not be convenient or timely. What may be of use is the knowledge that this recent input to flows could lead to (and has led to) movements in stocks and ETFs to levels that defy valuation. On the flip side, when a popular stock disappoints, it could lead to buying opportunities as buyers hollow out. While most studies have focused on the impact of social media on small cap stocks, it would not surprise if retail also had an appreciable impact on popular big-cap stocks. Perhaps it was a factor Apple’s surge in August last year and subsequent fall in September. In short, we have seen and can continue to expect excessive movements that could lead to both buying and selling opportunities as stocks rise and fall in popularity.
Who will Blink?
Bears keep pointing to sky-high equity valuations, a very hot IPO market, record volumes, and the parabolic performance of certain thematic baskets where the majority of companies are unprofitable. Bulls see a recovering economy, particularly in the US, unprecedented stimulus, zero interest rates for the foreseeable future, the fastest vaccine rollout in history, and negligible inflation. As a short-term fillip, with over half the S&P500 companies having reported, 80% have beaten the consensus EPS estimate, and by a whopping 19%, with a 4% topline surprise. The story is similar in Europe and Japan, albeit to a lesser degree.
For the moment, the bulls are winning and as we saw in the 1990’s, a frothy market can last for longer than many bears can hold out. Nevertheless, we make no prediction on short-term direction, but suggest clients to analyse stocks at face value. For instance, on the claim there is a lack of inexpensive stocks, we propose three big cap examples – UnitedHealth, Qualcomm and FedEx. All have forward PERs in the teens and are expected to report robust operational numbers this year with or without COVID. Facebook is also worth mentioning with a forward PER that is below the S&P500 average. This is the first time that has occurred since Facebook listed in 2012. These are not poorly performing stocks – they have all outperformed the S&P500 over the last 12 months. However, you could say they are currently a little out of favour. This segues back to our earlier suggestion that the retail trade can well help to provide opportunities to buy quality stocks that are unpopular.
Chart: Performance of Select Inexpensive stocks

Source: Bloomberg, Odyssey
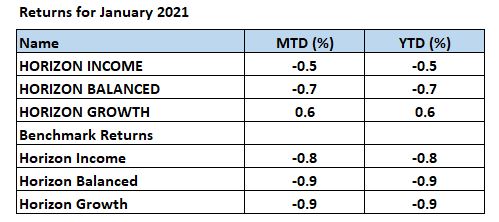
Horizon Performance
If you like to receive more information on our portfolios solutions, please contact us here: info@odysseycapital-group.com

Jan 8, 2021 | Articles, Global Markets Update
January Market View
Equity Market Recovery – Historical Context
The very optimistic November market sentiment carried over to December. Again, all risk assets recorded robust gains, albeit at a lower rate than the previous month. The big question now is whether the strong momentum shown in the last two months can carry over into the New Year.
“Unprecedented” is a word often used about the COVID crisis and certainly most of us have never experienced a similar situation. While it is also an unprecedented situation for the financial markets, broad equity index performances have certainly experienced a similar backdrop. In the last 50 years we have seen a similar rate of recovery from market lows three times – from September 1974, July 1982, and of course from February 2009 during the GFC. It is interesting to note that in these three periods, and indeed for the recovery of all seven previous drawdowns in the last 50 years of greater than 20%, that there appears a significant resistance level after the MSCI World Index approaches 40-50% recovery. Ominously, we are about there now in this recovery.

Source: Bloomberg, Odyssey
As market veterans realise, every situation is slightly different, and this time may end up reacting very different than history. However, markets also do tend to repeat themselves in a broad sense. At the end of the day, none of us have a crystal ball, so we advise investors not to get caught up with the hype and stay disciplined with their risk allocations and investment decisions.
The short-term question is what the January performance will look like and whether that is a harbinger for 2021 performance. While there is plenty of statistical evidence for “Sell in May and Go Away” until November, the evidence for January is less clear cut. In the last 50 years, the proportion of times both January and the full year return was positive is just 54%. You don’t need to run the stats on that to realize the two are not correlated. The proportion of times that January is positive is 64%, again hardly something to get excited about. Compare that to the 78% of years where the month of December is positive.
Why is the Equity Market so Much Higher than pre-COVID?
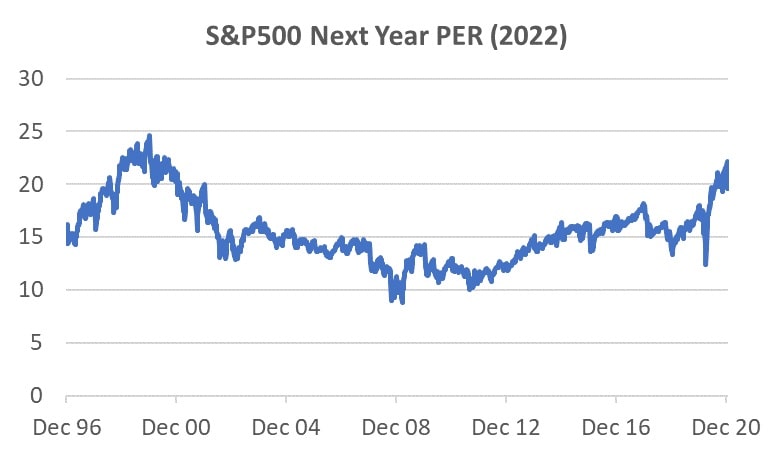
The simple answer is valuation multiple expansion. Optimists may say that valuation multiples should be high at the bottom of the economic cycle and low at the top. This phenomenon can be seen in many cyclical industries. However, for the market as a whole, there is little empirical evidence for this. The only time we have seen forward PER estimates this high was during the Dotcom boom and that was a speculative rally. Under this scenario, stock prices rise if the gain in EPS is higher than the fall in the EPS multiple. How does the maths stack up when looking at the S&P500 and consensus EPS forecasts? The S&P500 is trading on a next year (2022) forward PE multiple of 19.5x. This is 32% higher than the 13.3x multiple in 2010-2015 period in the years when the market was climbing out of the GFC when we also had zero interest rates. The market is expecting earnings growth to slow in 2022. If we assume this as peak cycle, we would expect the forward PE ratio to fall at least back towards the average of 13.3x, if not below. This means 2022 EPS expectations need to be 42% higher than 2020 level and 22% higher than the very strong 2019 level in order for the market to merely stay flat. This appears a tough ask.
However, should the market believe a higher market multiple is justifiable for longer, then the reliance on EPS growth is lower. This situation may play out should the recovery appear strong in 2021, providing the expectation strong growth will remain for 2022. Periods of high valuations can persist, as they did in the late 1990s, and while they have historically always reverted to mean, the timing is difficult to predict.
Source: Bloomberg
Diminishing Choices
Since the trough of the equity market in March 2020, the MSCI World Total Return Index has surged by a staggering 70%. However, despite positive inflows in November after the US elections, US equity has experienced fund outflows in a trend that has persisted since 2015. In the liquid space the main beneficiary has been credit and in the illiquid space, while transactions have slowed significantly, the growing popularity of private equity, credit and real estate appears undiminished.
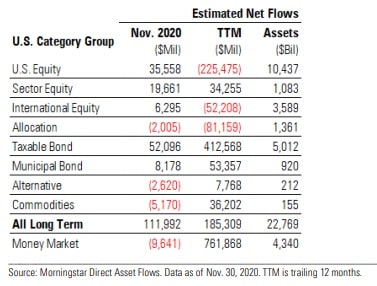
The positive takeaway from this for equity markets is that it appears investors are underweight equity, and its most liquid rival for fund flow, bonds, is providing a historically low yield. The Bloomberg Barclays Global Credit Index is currently yielding 1.4%. It is doubtful many investors, private or institutional, would be satisfied with that return, even for a relatively “safe” asset class.
Performances
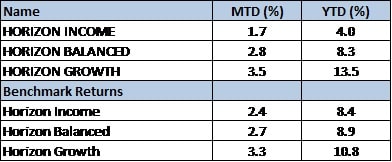
December Returns
If you like to receive more information on our portfolios solutions, please contact us here: info@odysseycapital-group.com


