
Jul 9, 2020 | Articles, Global Markets Update
Market View
Wild Horses
In June, risk markets defied rapidly rising new COVID cases in the US and powered higher. Admittedly, the 1.8% rise in the S&P 500 was primarily driven by a 7% rise in the Information Technology and a 5% rise in Consumer Discretionary sectors. Commodity markets also took an optimistic view, choosing to focus on the loosening of restrictions rather than the continuing rise in new COVID cases that reached over 200,000 per day. This seems to be affirmation of two beliefs; 1) China’s recovery was gaining traction, and 2) the bet that 2nd wave cases would not result in the wholesale global return of mobility restrictions. This led to WTI oil and copper prices to surge 11% and 12% respectively. Equity markets and currencies that had significant commodity exposure rose accordingly. The once popular economic indicator, the Baltic Dry Index, shot up 260%, mainly on the back of increased iron ore shipments to China.

Source: Bloomberg
Indeed, China’s improved industrial production, industrial profits and retail sales numbers for May provided a sense of economic stability. When the positive PMI figures were released at the end of June, indicating an improving trend, China’s equity markets initiated one of its infamous “ears pinned back” rallies. Just one week into July, the CSI 300 has jumped 14% and the MSCI China Index has scrambled to keep up with a 9% surge. While the economic data provided a supportive backdrop, it has been the media drive by the government for people to invest in the equity market that is likely to have had a material impact to the speed of the rise. This is reminiscent of the 2015 boom bust where the CSI 300 doubled in just two months but then gave back 80% of the climb in the subsequent two months. The whole up and down move was largely due to government encouragement and then cessation of the media campaign. Hopefully, experience will temper the market enthusiasm this time.
Tail of 4 Markets
The reliability of China’s economic data has been in question since the 1990’s. If we assume it’s a reasonable representation, based on simple PMI comparisons it could be argued that China’s equity market performance should, indeed, be ahead of other major markets. China only suffered one dramatic month’s dip in PMI before heading back to growth again. Other major regions have suffered 3-4 months of below 50 readings. China’s equity market did not fall dramatically until markets in other regions began to plummet. This occurred when you could argue China’s economy was already stabilising.
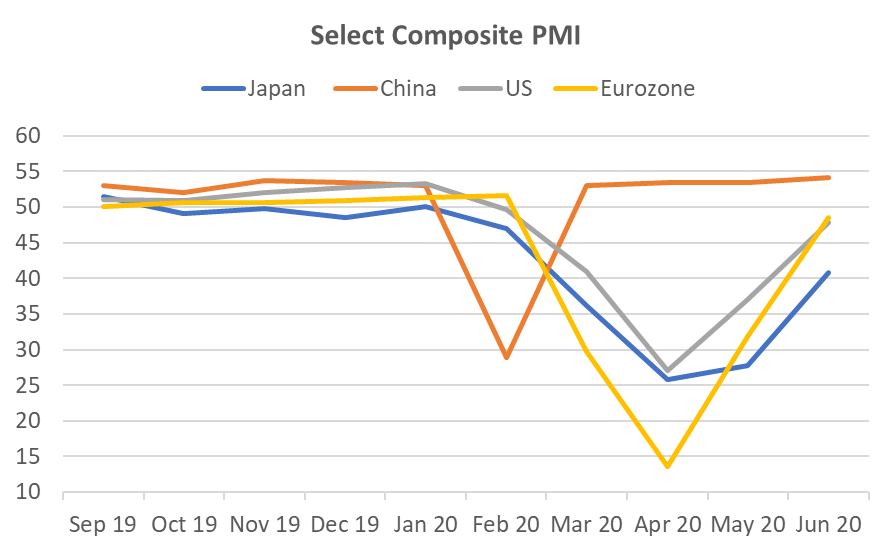 Source: Bloomberg
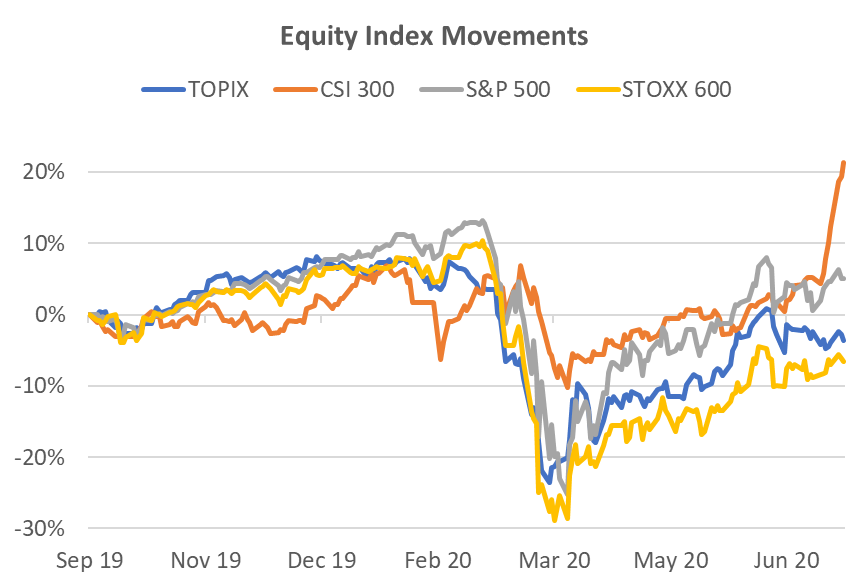 Source: Bloomberg
The other point worth noting is that both the best performing indices, CSI 300 and S&P 500, have less exposure to offshore revenue than either the Topix or the Stoxx 600 that have more than 60% of revenue from offshore. The means any stimulus is likely to be more efficient for the companies in the China and US indices.
Laggards Still Lagging
The market likes what it likes. Currently that does not include banks and industrial stocks, globally. These sectors tend to be more exposed to lockdown restrictions that have been slower than expected to unwind. In a related statistic, in June, US Growth stocks rose 4.1% while Value stocks fell 1% to continue a well-worn path for the last 10 years with the rise and rise of tech stocks. The eventual recovery of the laggards probably heralds the final phase of the equity market dislocation.
This laggard theme also extends in a smaller scale to the credit markets where Asia corporate bonds remain 230bp wide of US corporate bonds. However, Asian bond credit spreads are steadily grinding tighter against their US counterparts, making it an easier choice than exposures to nominally cheap but unloved stocks.
 Source: Bloomberg
If you like to receive more information on our portfolios solutions, please contact us here: info@odysseycapital-group.com
Jun 15, 2020 | Articles, Global Markets Update
Welcome to the May issue of Odyssey’s Lex Capitis, Odyssey Corporate Advisory’s publication that highlights capital and financial markets developments and its potential implications for you and your business.
Odyssey Corporate Advisory is an independent boutique consultant providing business advisory, investment consultancy, and capital markets project management and coordination services catered for your circumstances and preferences.
It would be an understatement to say that the social unrest in 2019, trade war and Covid-19 presents a challenge for businesses. As we approach the mid-2020, businesses that are considering listing in Hong Kong might find it difficult to meet eligibility requirements unless special dispensation is given by the regulators. So what sort of Hong Kong IPOs should investors expect?
Download the full article here.
Lex Capitis is Odyssey Corporate Advisory’s periodical that highlights capital and financial markets developments and its potential implications for you and your business.
Odyssey Corporate Advisory is an independent boutique consultant providing business advisory, investment consultancy, and capital markets project management and coordination services catered for your circumstances and preferences. Corporate Advisory is a division of Odyssey Asset Management Ltd, a Type 1, 4 and 9 SFC licensed Hong Kong company and subsidiary of the Odyssey Group.

Kuan Yu Oh
Managing Director, Co-Head of Corporate Advisory
Mobile: +852 6971-7989
Email: kuanyu.oh@odysseycapital-group.com
Notice
This publication is for informational purposes only and does not address the circumstances of any particular individual or entity. It does not constitute financial advice and should not be used as such. You should seek a duly licensed professional for financial advice. For more information about please see our Disclaimer.
Jun 10, 2020 | Articles, Global Markets Update
Market View – The Old Normal
Our caution last month proved to be unfounded. The power of the unprecedented stimulus, zero interest rates and the prospect of loosening of lockdown restrictions won the battle against extreme lows in economic activity and the prospect of worst economic data to come. As a result, the World MSCI Index is up 14% since mid-April, and up a whopping 43% since the March trough. The Index now sits at only 6% below the pre-COVID peak. Virtually all risk assets moved up in tandem, including credit. Even oil staged a big rally, rising to USD38 per barrel. The confirmation that the market hadn’t lost all sense occurred last Friday when US unemployment fell to 13.3%, a 1.4% decline from the April figure. This was a particularly large positive shock since some commentators were fearing a number closer to 20%. The other shoe has yet to fall, and those that are waiting, may be in for a long wait. Last week the US interest rate curve steepened 15-25bp for 5-10Y.
Despite market movements, the world is not yet back to normal. The trend in new COVID infections globally is actually still rising. However, the regions that concern the financial markets, namely US and Europe, there the trend is falling, even if the fall is stubbornly slow. Significant restrictions still apply in most countries. The daily new cases in the US still number approximately 19,000, a large quantum.

Source: JHU CSSE
Act 4 in a 5 Act Play
We are now in the 4th Act of the expected 5 Act COVID play for equity markets. The Acts can be characterised as:
Act 1: 3rd week of February. Stocks and other risk assets begin to sell off indiscriminately. The culmination of the first Act was the implementation of the lockdown and social distancing that resulted in the market trough on the 23rd of March.
Act 2: Last week of March. The market realized that there were beneficiaries to the austere policies and we witnessed share prices for online businesses start to surge.
Act 3: 1st week of April. Interest swung to quality businesses that were not beneficiaries of the policies but were partly resistant to the situation and would survive largely intact.
Act 4: Mid-May. The 2nd week of May was when Europe began to loosen lockdown restrictions. By mid-May investors started to support stocks that were heavily affected by COVID policies but were likely to survive as long as the end of the policies remained highly visible. This includes the Banks and Industrial sectors.
Act 5: 3rd – 4th week June? Equity markets to recover their previous peak? Currently, the MSCI World Index is 6% below the pre-COVID peak.
While we have yet to see how Act 5 develops, or whether there is a surprise Act 6 or 7, we find it incredible that it may be possible that in just 4 short months that the equity markets could have plummeted as well as recovered during a time when we are witnessing some of the worst economic data the world has seen since the Great Depression. Indeed, the Global Credit Index (USD corporate bonds) is already up 2% YTD.
Room Left in Laggard Play
While much of the low hanging fruit was picked last week in terms of the under-performing Banks and Industrials, we believe there is still value in the laggard play. Value has been beating Growth in recent weeks, and while this may be a temporary blip to the 10-year Growth out-performance, participating in trend reversals can add meaningfully to performance.
We note that Banks remain 27% below the S&P 500’s peak on the 19th February, compared to Consumer Discretionary, Information Technology, and Healthcare, the sectors that have already regained their previous peaks. Because we are mid-cycle in the laggard recovery, we expect there to be some volatility, but as the global economy slowly climbs out of lockdown, we expect the laggard plays to continue to play catch-up. In Industrials, travel related stocks such as airlines and cruise ships, surged last week. This is likely to remain a highly volatile sub-sector but and may represent a highly sensitive play to the loosening of lockdown restrictions.

Figure 2: Performance of S&P 500 Sectors Since pre-COVID Peak Source: Bloomberg
If you like to receive more information on our portfolios solutions, please contact us here: info@odysseycapital-group.com

Jun 5, 2020 | Articles, Press Releases
Odyssey Group Ltd is pleased to announce the partnership with the Australian Stock Exchange listed, K2 Asset Management (ASX Code: KAM).
Odyssey is constantly seeking ways to drive value for its clients and has been researching solutions to further develop its asset management offering to meet the demand of the firms ever evolving client needs. Odyssey has selected K2 from a large number of possible partners. K2 will assist Odyssey on a number of business lines, including co-managing Odyssey’s in-house Horizon Discretionary Portfolios, bespoke portfolio services and Odyssey’s Satellite trade service, Navigator. Odyssey’s clients in turn will benefit from K2’s experienced team and resources, as well as K2’s consistent alpha that they have generated over the past 21 years.
The following is a summary of K2’s pedigree:
- K2 has a 21 year track record of delivering consistent alpha through multiple economic cycles.
- K2 is an ASX listed Boutique Fund manager which is 68% owned by staff and related parties (ASX Code: KAM)
- K2 operates 5 equity products, including: 2 Australian funds and 3 international funds, along with several other client mandates.
- In September 1999, K2 became one of Australia’s first Long/Short Funds.
- K2 Australian Small Cap Fund (ASX Code: KSM) is the only small cap active listed ETP in the market.
- K2 has 14 staff including 6 dedicated investment professionals.
- K2’s current funds under management is AU$120M.
- K2 has 20 years of investing in Absolute Return fund strategies with a proven track record of persistent alpha generation.
- K2’s focus is on capital preservation with a focus on alpha generation via their proprietary stock selection process.
- Being an absolute manager, K2 have the ability to move to 100% cash at any time.
For further details please visit K2’s website here.
Campbell Neal, Chairman and CEO of K2 commented:
“K2 are pleased to partner with Odyssey as our Asia Pacific partner and to further extend our reach into the Asian region. We look forward to assisting the Odyssey team in managing their client’s investment portfolios and funds”.
Alex Walker, Co-Founder & CEO of the Odyssey Group Ltd added:
“Odyssey is excited about its partnership with such a seasoned and professional firm that is K2. We look forward to our clients benefiting from K2’s 21 years of out performance and strategic insight into the global markets.”
Odyssey’s partnership with K2 highlights sustained interest by Asia Pacific based clients in accessing institutional-quality investment portfolio solutions, that are independent and unconflicted.
The original K2 press release can be accessed here.
Please see the press release as featured in the Australian Financial Review online or download a copy here.
If you would like to learn more, please contact your Odyssey Wealth Manager or contact Jeff Hiew.

May 15, 2020 | Articles, Global Markets Update
Lex Capitis Odyssey Corporate Advisory’s periodical that highlights capital and financial markets developments and its potential implications for you and your business.
Odyssey Corporate Advisory is an independent boutique consultant providing business advisory, investment consultancy, project management and coordination services for companies that intend to access the Hong Kong capital markets.
Searching for Diamonds in the Rough
Source: Bloomberg, Odyssey Capital
Summary:
- IPOs of Singapore and Malaysia companies during the two months of 2020 have outperformed the market;
- The price-performance of IPOs with cornerstone investors, on average, performed better than IPOs that did not have cornerstone investors during this period. However, stock-specific factors in each IPO were the key determinant in price performance;
- Size matters, on average, during this period as IPO with a market capitalisation that is greater than HK$1 billion performed, on average, better than IPOs market capitalisation less than HK$500 million. However, stock-specific factors in each IPO drove the disparity in price performance.
IPOs during January and February 2020
During the first two months of 2020, 24 companies listed on the Stock Exchange of Hong Kong. 22 companies were listed on the Main Board and two companies on GEM. There was no one particular industry that dominated, with companies ranging from the construction to television industries. Four IPOs (Wenye Group, Wah Wo Holdings, Jiachen Holdings and China Hongguang Holdings) were undersubscribed in their placing offer and one IPO (HuiJing Holdings) was undersubscribed on the public offer.
| Geography |
Board of listing |
No. of IPOs |
Average returns of IPOs |
Average returns of IPOs adjusted by HSSI returns |
| China |
Main Board |
17 |
-27% |
-19% |
| Hong Kong |
Main Board |
3 |
-38% |
-31% |
| Macau |
Main Board |
1 |
-57% |
-54% |
| Singapore |
Main Board |
2 |
43% |
56% |
| Malaysia |
Main Board |
1 |
-6% |
2% |
|
|
|
|
|
| China |
GEM |
2 |
-37% |
-30% |
Figure 1: Average IPO returns
Source: Bloomberg
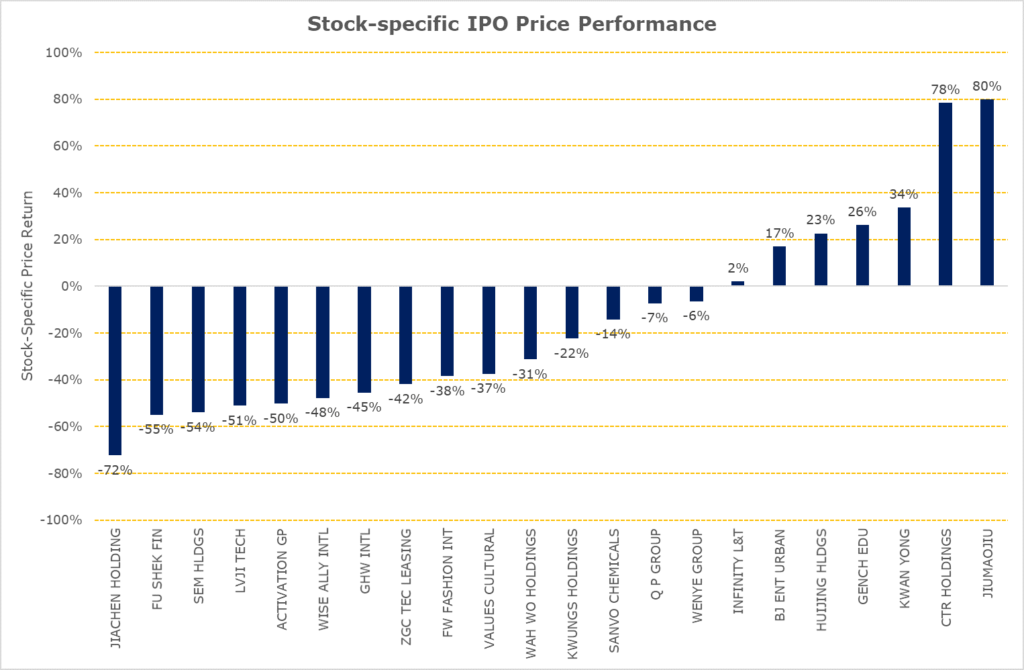
Given the current market environment, we examined the stock-specific returns from their IPO date to 29 April 2020 by adjusting each IPO’s price-performance by the price return of the Hang Seng Composite Small Cap Index (“HSSI”). The HSSI is the appropriate market proxy because the IPO market capitalisation of the companies during this period ranged HK$500 million to HK$10,140 million which is within the scope of HSSI’s constituents market capitalisation. Contrary to an earlier media report about the unattractiveness of South-East Asian companies listing in Hong Kong, investors would, on average, have benefitted from investing Malaysian and Singaporean companies that IPO during this period.
Time to Listing
| Longest application days |
345 |
| Average application days |
198 |
| Shortest application days |
119 |
Figure 2: Timing from application to allotment of Shares
Source: Odyssey Capital
There was no change in the time required for the listing process, the average time from submission of the IPO application until the allotment of shares took more than six months, i.e. it required at least one renewal of the IPO application. The IPO that took the longest was almost a year whilst the shortest took just under four months. There was no discernible difference in the time required between main board applications and GEM board applications.
Size Matters?
| Stock Code |
Name |
IPO Market Capitalisation (HKD Millions) |
IPO returns adjusted by HSSI returns |
| 09968.HK |
HUIJING HLDGS |
10,140 |
23% |
| 09922.HK |
JIUMAOJIU |
9,131 |
80% |
| 01745.HK |
LVJI TECH |
2,990 |
-51% |
| 01525.HK |
GENCH EDU |
2,511 |
26% |
| 03718.HK |
BJ ENT URBAN |
2,484 |
17% |
| 09919.HK |
ACTIVATION GP |
1,616 |
-50% |
| Average Stock-specific IPO Price Performance (Market Capitalisation greater than HK$1,000 million) |
7% |
Figure 3: Large IPOs
Source: Bloomberg
| Stock Code |
Name |
IPO Market Capitalisation (HKD Millions) |
IPO returns adjusted by HSSI returns |
| 02528.HK |
FW FASHION INT |
800 |
-38% |
| 01802.HK |
WENYE GROUP |
630 |
-6% |
| 01412.HK |
Q P GROUP |
628 |
-7% |
| 01442.HK |
INFINITY L&T |
620 |
2% |
| 00301.HK |
SANVO CHEMICALS |
556 |
-14% |
| 01937.HK |
JIACHEN HOLDING |
530 |
-72% |
| 09998.HK |
KWAN YONG |
520 |
34% |
| 01740.HK |
VALUES CULTURAL |
519 |
-37% |
| 01925.HK |
KWUNGS HOLDINGS |
518 |
-22% |
| 09933.HK |
GHW INTL |
510 |
-45% |
| 01601.HK |
ZGC TEC LEASING |
507 |
-42% |
| 01416.HK |
CTR HOLDINGS |
504 |
78% |
| 02263.HK |
FU SHEK FIN |
500 |
-55% |
| 09929.HK |
SEM HLDGS |
500 |
-54% |
| 09918.HK |
WISE ALLY INTL |
500 |
-48% |
| 09938.HK |
WAH WO HOLDINGS |
500 |
-31% |
| 08500.HK |
ICONCULTURE |
250 |
-48% |
| 08646.HK |
CHINA HONGGUANG |
231 |
-13% |
| Average Stock-specific IPO Price Performance (Market Capitalisation less than HK$1,000 million) |
-23% |
Figure 4: Small IPOs
Source: Bloomberg
Although on average, IPOs with a market capitalisation greater than HK$1,000 million performed better than IPOs with a market capitalisation less than HK$1,000 million, there was a wide disparity in price-performance between IPOs. Compared to LVJI Technology Holdings and Activation Group Holdings, 12 small IPOs had smaller negative returns. CTR Holdings and Kwan Yong Holdings had better returns compared to Huijing Holdings which was the largest IPO for the period.
Odyssey Corporate Advisory is a boutique corporate advisor providing independent and impartial investment and capital markets consulting services catered for your circumstances and preferences. Corporate Advisory is a division of Odyssey Asset Management Ltd, a Type 1, 4 and 9 SFC licensed company and subsidiary of the Odyssey Group. If you have any enquiries, please contact:

Kuan Yu Oh
Managing Director, Co-Head of Corporate Advisory
Mobile: +852 6971-7989
Email: kuanyu.oh@odysseycapital-group.com
Notice
This publication is for informational purposes only and does not address the circumstances of any particular individual or entity. It does not constitute financial advice and should not be used as such. You should seek a duly licensed professional for financial advice. For more information about please see our Disclaimer.
May 13, 2020 | Articles, Global Markets Update
Market View
The equity markets have been buoyant for the last 6 weeks. Global virus cases have peaked and many countries have started a tentative process of loosening lockdown restrictions. To assist the recovery, G20 countries have announced a stimulus program that is equivalent to 9.3% of combined GDP, notably supported by close to zero interest rates. This level of stimulus is unprecedented.
On the other hand, we have almost total cessation of activity in very large swathes of the global economy, particularly in the service industries that constitute 65%-75% of GDP for Europe and the US. This sector employs a similar level of the workforce. US unemployment has already reached 14.7% with a 2% lower participation rate. Unemployment rates in the US and Europe are expected to peak in Q2 with significant recovery by year end. Whether the current valuations of the equity market are justified depends on the speed at which lockdown measures are removed and how rapidly the global economy normalizes.
In the last three recessions, it has taken an average of approximately 4 years for earnings per share and the unemployment rate to reach the previous peak. This is clearly not what the market is expecting with the huge stimulus in place. The 2021 estimated PER for the S&P 500 is close to 18x, approximating the highest level for the last 5 years and a level that hasn’t been breached since the Dotcom boom, twenty years ago.
Muddying the situation is that famous brands that are weathering the lockdown well are at all-time high two year forward PERs. We all know of the usual suspects that have benefited from the lockdowns such as Netflix and other online businesses, as well as pharmaceutical companies share that have skyrocketed due to their work on a vaccine. However, some of the largest consumer discretionary companies that have been negatively affected by the virus, but are expected to bounce back strongly, are also at highly elevated valuations. This is in contrast to those businesses seen as the most vulnerable to the virus where valuations have plummeted. Unlike previous deep recessions, the high-quality businesses you want to own for the long term never really became cheap. As Warren Buffet recently lamented “we don’t see anything attractive to do”.
We have entered the statistically weaker May-Oct period for equity markets. So far, sentiment has been buoyant due to prospect of lockdown restrictions loosening. The market is like a prisoner getting excited at the prospect of getting out of jail. However, once we are out, reality will set in and the hard slog of getting back into a normal life begins. There will be times when we wonder why we were so excited, and for many, finding a job in the real world will be very difficult for some time.
The US market bounce from the bottom has been rapid. From its March 23 trough, the S&P 500 has taken just 26 days to regain 60% of its previous peak after the 34% fall. Following the 2008 GFC, it took 373 days to reach this level of recovery. Perhaps, this is a tough comparison since the market fell 57%. The closest in terms of peak to trough fall and the speed of the fall was the 1987 Crash when the market fell 33% in the space of days, but then it took 469 days to recover 60%. The fastest recovery before the current situation is the 1990-91 recession. Here, the peak to trough was only 20%, but the 60% recovery was reached in 111 days. The market appears to be expecting that the huge stimulus package, zero interest rates, and the fact that this recession was caused by government actions specific to the Coronavirus and therefore, can be undone by the reversal of those policies, to be the game changers.

Figure 1: Market Crash Comparison Source: Bloomberg, Odyssey Capital
Where is the Value?
The speed of the equity bounce was a surprise. What should not have been a surprise was the transient nature of the huge spike in equity volatility, the level of which rivalled the GFC. That was an excellent time to be short equity volatility in structured products where you were overly compensated for risk. Now that the volatility opportunity has faded, what are the current opportunities?
On a relative basis, valuations for Asian and European equity indices are close to their nadir relative to the US. While European equities show the same symptoms as the US market where resilient quality businesses are priced very expensively, the same characteristic does not appear as prevalent in Asia. For the latter there are still quite a few quality businesses we’d like to own for the long term on historically modest valuations.
By asset class we still prefer fixed income. While the US investment grade indices are already back to where they were at the beginning of the year, BBB spreads remain close to 100bp wider. US high yield (HY) is still trading at a wide credit spread of 720bp, implying a 5yr default rate of approximately 50%. Since the majority of US HY bonds are issued by listed companies, what does it say about the equity value of those companies? What many equity investors may forget is that there is contractual obligation for a company to repay that bond and the interest, and if they do not pay, bondholders can force a liquidation of the company. In such a case, equity holders rank last to receive money, if there is any left. Often, there is not. This payment ranking system is the reason why in a crisis situation corporate credit generally outperforms equity by a wide margin. However, in the last couple of weeks, equity has roared ahead while bond spreads have remained stagnant. This suggests there is a disparity between the corporate risks that bondholders perceive, particularly for high yield, and those that equity holders perceive.
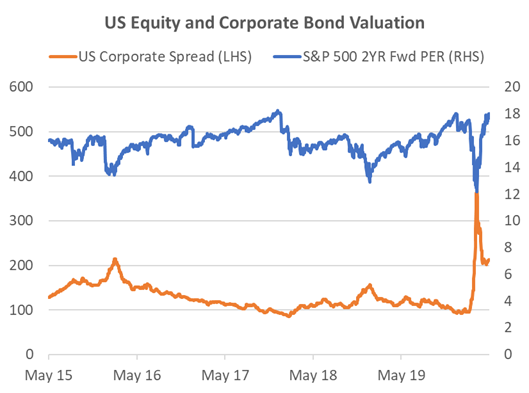
Figure 2: US Equity and Corporate Bond Valuation Source: Bloomberg, Odyssey Capital
In alternatives we also note that some managers are creating new funds to take advantage of the current dislocation in markets, particularly in the private credit space. These provide significant interest. However, we remain a little cautious of ongoing vehicles that have yet to mark down their investments to account for the current business environment. Private investment valuations often show little correlation to the public markets. The only time that changes is when the real economy is affected significantly. Then the correlation is very high, even though it is revealed on a lagged basis.
If you like to receive more information on our portfolios solutions, please contact us here: info@odysseycapital-group.com


 Source: Bloomberg
 Source: Bloomberg
 Source: Bloomberg


