
Mar 10, 2021 | Articles, Global Markets Update
March 2021 Insight
Inflation is a Dirty Word
If there was one factor that could knock the rally in risk assets on its head is the specter of inflation. That would remove the easy money that has been fueling markets. Right now, it is just the speculation of inflation as indicated by moves in the 5Y treasuries and beyond. Certainly, we have seen some positive inflation in recent data, and that’s a good thing. If we didn’t, it would mean the global economy was not recovering and the markets would have something far worse to contemplate. Indeed, if the recovery accelerates with the distribution of vaccines, headline inflation (CPI) may well surpass the often quoted 2% target in the next couple of quarters term due to low comparisons in Q2 2020 when US CPI fell close to zero. Further, the World Commodity Index has surged 63% since April 2020, which represents large rises in energy and raw material prices.
While headline inflation may cause concern for markets, most governments base monetary policy on some form of core inflation that often excludes food and energy prices. The US Fed favours the Core Personal Consumption Expenditure (PCE) Index as one its measures and this has not been above 2.5% since 1993. Indeed, there has been a falling trend in the PCE over the last 50 years and this unsurprisingly has coincided with the fall in unit labor costs per real GDP. The only time it has sustained above 2% for any length of time in the last 25 years was during the credit bubble of 2004-2008 when it was continually just above 2%. What has been driving this disinflation? My own opinion is that the root cause is accelerating technology adoption and diminishing wage growth due to an ageing working population. In 1999, workers of age 55+ were just 12.7% of the workforce. By 2019 this had almost doubled to 23.4% and by 2029 the U.S. Bureau of Labor Statistics forecast this age group to comprise 25.2% of the workforce.
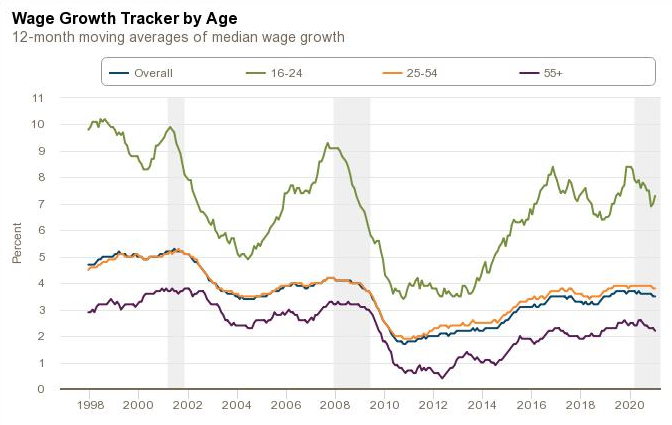
Source: Federal Reserve Bank of Atlanta
Since I am expecting these root forces to continue, it is not expected that the PCE Index to sustain above 2% for an extended time. From the Fed’s dovish comments, we appear to agree. However, the US yield curve is pricing in a rate hike as early as 2023 which is obviously earlier than the Fed’s expectation. Apart from jaw-boning, there is little the Fed can do to affect pricing several years beyond the target rate. The current 2Y-10Y differential is at 1.45%, above the previous spike of 1.34% in December 2016 and close to a potential resistance at 1.5%. Prior to that we had spikes to 1.76% in June 2015 and 2.61% in December 2013. In terms of absolute level of the 10Y UST, the 1.59% yield is similar to that in 2016 and 2012.
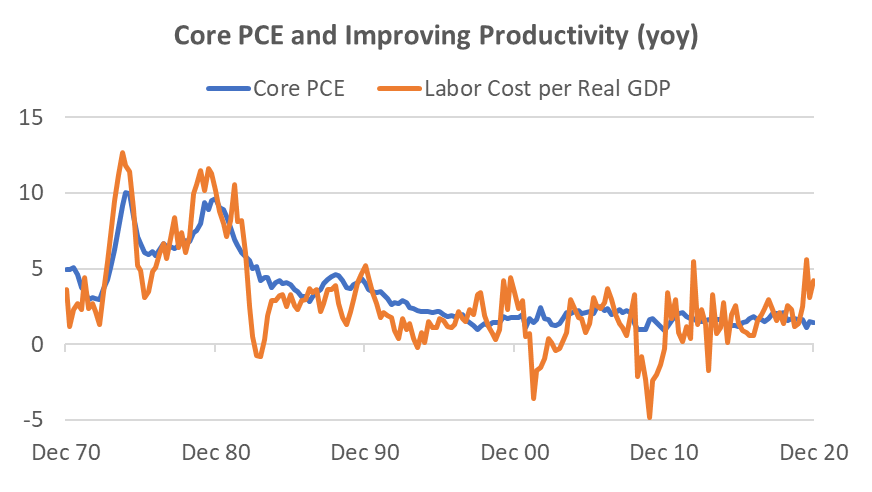
Source: Bloomberg
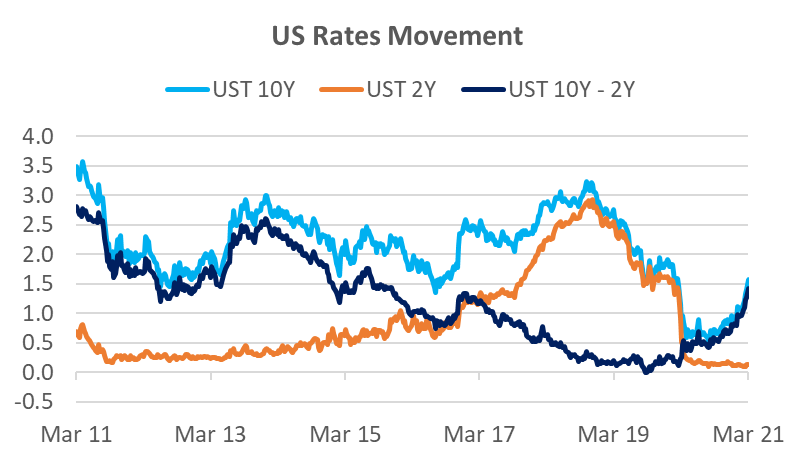
Source: Bloomberg, Odyssey
The Pain Trade in Rates
Several generations of bond traders have made fortunes from being long bonds – making money from when bond yields fall. That is because this has been the trend for three decades. Few traders like to short bonds, because they are betting against the trend. In addition to the specter of inflation, rising bond yields can have significant momentum for a time; everyone is betting in one direction and with significant leverage (often 10x or more). As the bond yields rise and prices fall, it becomes a pain trade for bond traders, and it ends up being a scramble to close out their long positions. The other marginal large player in rates are the large CTA (commodity trading advisors) funds that are followers of directional trends. Commentary suggest they close out their long bond positions in January and started to build up short positions in February. Trend algorithms do not have a human trader’s reticence or care about fundamentals.
Usually when bond yields rise, bond traders have an inkling that either inflation is rising faster than expected or that the government is about to alter monetary policy. In this case, we have only glimpsed the barest evidence of inflation and the Fed has been steadfast in its monetary policy. This is a reason why the bond market and equity investors have been caught a little off-guard, and probably why yields have been higher than what might be expected from fundamentals. Are yields heading even higher? Since the answer appears more technical rather than fundamental, then the short answer is that it is certainly possible.
Dealing with Adjustment Pains
It is not helpful when a market commentator says that the current clearing out in stocks is good for medium and long-term returns when you are losing money. The good news is that blue-chip stocks have been highly resilient. The S&P500 is down less than 3% from its peak and major European burses have hardly moved. In fact, US Value stocks continued to climb another 3% since the S&P500 peak and Banks are up +9%. It’s been the high growth and speculative stocks that have suffered. The Nasdaq has fallen 10% and MSCI China has fallen 16%. Speculative ETFs have fallen 20-30%. In terms of technicals, it’s worth noting that the Nasdaq has hit it’s 100-day moving average. However, the trend of the UST 10Y is likely to remain a major factor.
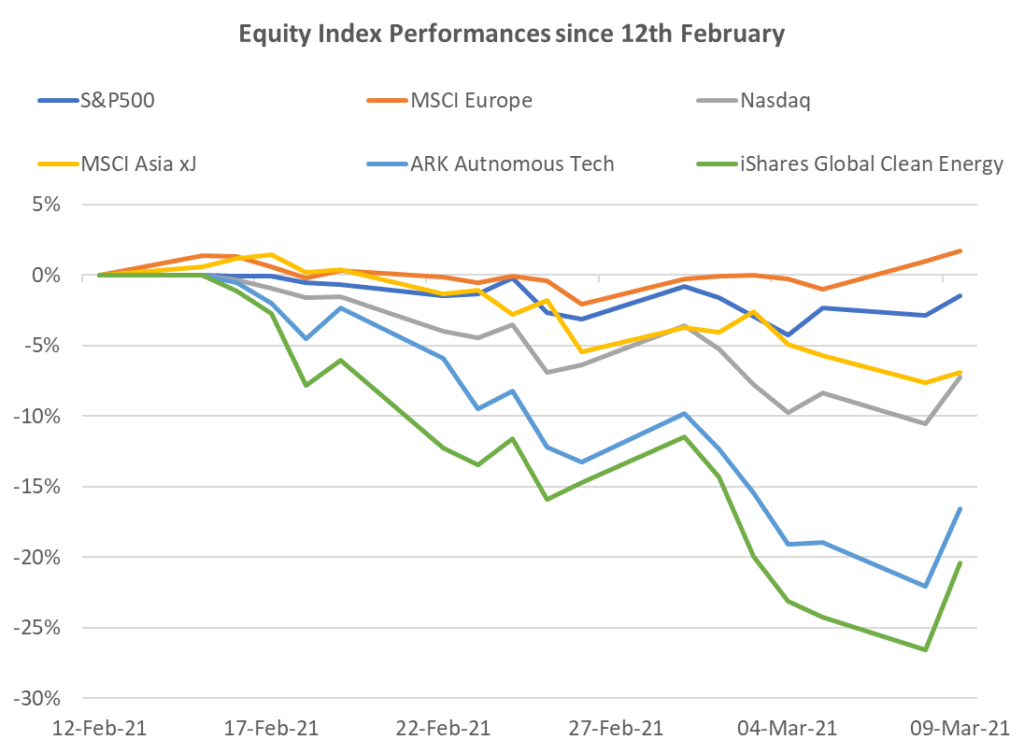
Source: Bloomberg, Odyssey
Mixed Bag in Other Markets
We have been warning about the temptation to buy long duration credit for yield since November last year. The Global Corporate Credit Index is down -4% YTD and US Investment Grade is down -5%. Global HY is largely flat YTD due to lower duration and assisted by a higher carry.
The one asset class that has unequivocally benefitted from the stronger economic outlook has been commodities. The London Metals Index is up +9% YTD, with copper up +14%. WTI Oil is +14% YTD and has moved in virtually a straight line up since the beginning of the year. The main commodity to suffer has been gold which is down -7% YTD and has lost some of its lustre due to the popularity of cryptocurrencies.
Investment Recommendations
When Boring is Good
Back in November 2020 when the Value v Growth issue in stocks first arose, we chose a slightly different tact. We suggested a 3 stock basket that was non-tech and seemed to perform in a steady fashion regardless of whether Value or Growth was favoured. The basket comprised UnitedHealth, Abbott Labs and Morgan Stanley. Since the end of November, the basket is up +14% and up +2% since the recent peak of the SPX500 on February 12. These have not been flashy stocks but together they would have helped to stabilize any equity portfolio and provided significantly better than market returns. All three have announced solid Q4 operational results and we have no qualms about continuing to recommend these stocks, particularly as a basket.
Value in Tech Yet?
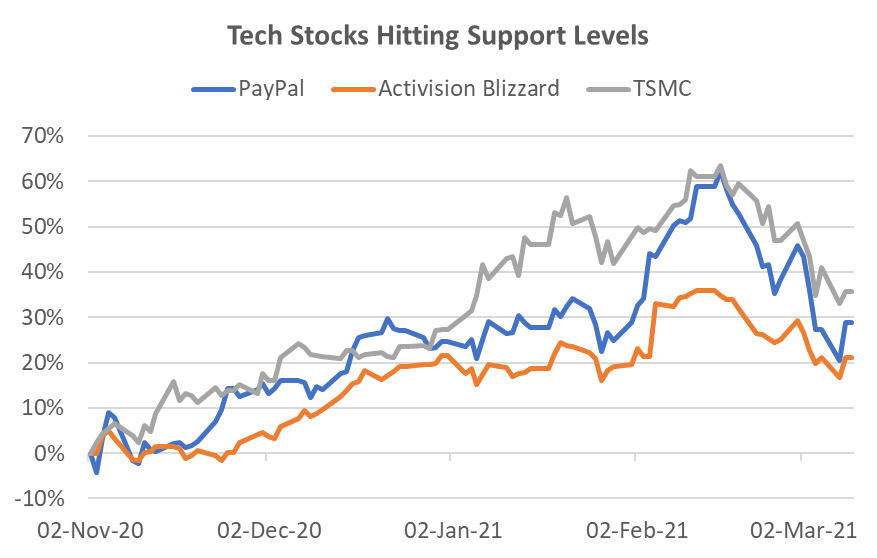
Despite the recent 10% fall in the US Infotech sector, the 1-year forward PER at 30x remains 40% higher than the 10-year average at 21x. Some of this is due to the 41% weight to Apple and Microsoft, but there is no denying the sector remains expensive. Nevertheless, the US Infotech sector has hit the 100-day moving average and if we can get some respite from rising rates, the potential for a technical bounce is possible. There are plenty of stocks that we have previously recommended that had very strong Q4 results but have fallen 20-25% to what appears to be technical support levels. These include Paypal, Activision Blizzard, and TSMC to name just three. However, to find one that is trading close to pre-COVID valuations is more difficult.
Source: Bloomberg, Odyssey
One such stock is Google. We rarely featured this FAANMG last year because its peers were overshadowing its performance, but the last two quarters have seen a marked operational improvement to firmly catch up with its peers. It has been a major beneficiary of the recovery in online advertising spend, but it is not burdened with as many political and sentiment issues as Facebook. In particular, its Youtube business has been riding a wave of popularity, and with a new product suite, the 45% revenue growth in Q4 2020 is expected to remain strong. Further, while Amazon and Microsoft continue to dominate cloud infrastructure, Google Cloud’s large customer acquisition program has started to improve, demonstrated by 46% revenue growth. Finally, Search remained a very solid performer with 17% revenue growth. At a valuation of 29x 2021 earnings, the stock is trading only slightly high to its usual range of 25-30x over the last 5 years. The stock has shown resilience during the growth sell-off and has only fallen 4% from market peak to trough.
Odyssey Model Portfolio Performance

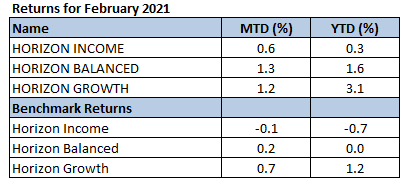
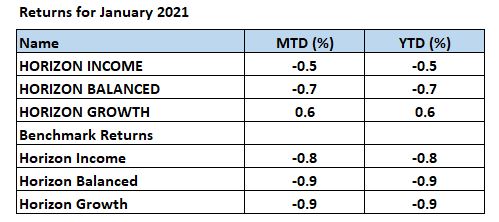
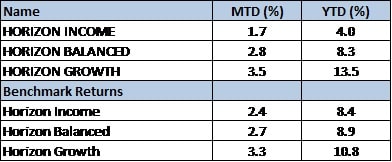
Horizon Performance
If you like to receive more information on our portfolios solutions, please contact us here: info@odyssey-grp.com.

Feb 10, 2021 | Articles, Global Markets Update
February Market View
Wall Street meets Social Media
The evolution of social media has turned into a revolution for the financial markets. Ten years ago, the mostly forgotten Arab Spring showed how nascent social media could galvanise the populace to cause social and political change. More recently we’ve seen social media propel the #MeToo movement, Donald Trump tweeting over 26,000 times as the POTUS and often using it to announce official news, Russia being accused of using social media to affect the 2016 US elections, as well as being used in the recent protest on Capital Hill. Now the financial markets are experiencing how effective social media can be in moving asset prices.
Chart: Bitcoin and Gamespot price
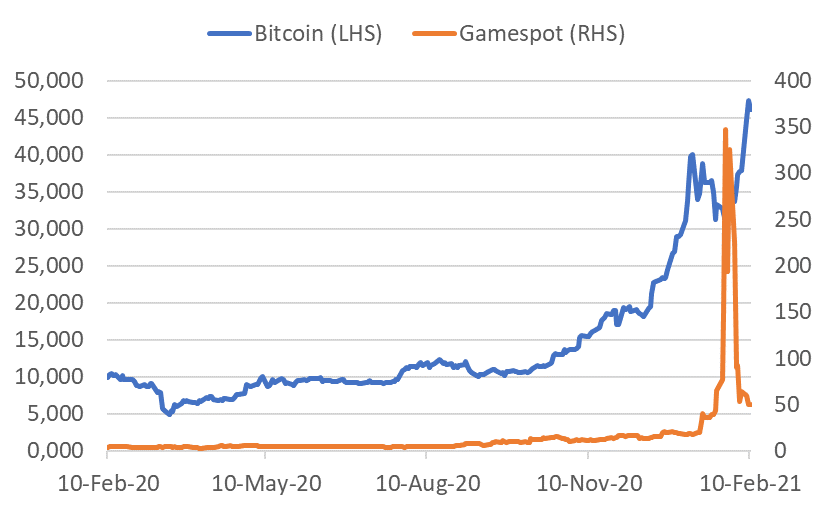
Source: Bloomberg
Dramatic price moves have occurred in Gamestop, AMC, and now Bitcoin through actions on social media. What does the increase in the use of social media platforms bode for investing? The use of social media for investment research has been prevalent for close to a decade. The rise of the “retail” or DIY investor can be seen by the massive growth fund flow to ETFs at the expense of the active manager. In recent months, the move has also transferred to individual stocks and stock options and this has been cited as a major reason behind the rally since November.
Chart: Net Call Option buys with less than 10 contracts on individual equities

Source: J.P. Morgan
The strength of the retail buying may be a major factor in market direction, at least in the short term. However, for most of us, monitoring retail flows may not be convenient or timely. What may be of use is the knowledge that this recent input to flows could lead to (and has led to) movements in stocks and ETFs to levels that defy valuation. On the flip side, when a popular stock disappoints, it could lead to buying opportunities as buyers hollow out. While most studies have focused on the impact of social media on small cap stocks, it would not surprise if retail also had an appreciable impact on popular big-cap stocks. Perhaps it was a factor Apple’s surge in August last year and subsequent fall in September. In short, we have seen and can continue to expect excessive movements that could lead to both buying and selling opportunities as stocks rise and fall in popularity.
Who will Blink?
Bears keep pointing to sky-high equity valuations, a very hot IPO market, record volumes, and the parabolic performance of certain thematic baskets where the majority of companies are unprofitable. Bulls see a recovering economy, particularly in the US, unprecedented stimulus, zero interest rates for the foreseeable future, the fastest vaccine rollout in history, and negligible inflation. As a short-term fillip, with over half the S&P500 companies having reported, 80% have beaten the consensus EPS estimate, and by a whopping 19%, with a 4% topline surprise. The story is similar in Europe and Japan, albeit to a lesser degree.
For the moment, the bulls are winning and as we saw in the 1990’s, a frothy market can last for longer than many bears can hold out. Nevertheless, we make no prediction on short-term direction, but suggest clients to analyse stocks at face value. For instance, on the claim there is a lack of inexpensive stocks, we propose three big cap examples – UnitedHealth, Qualcomm and FedEx. All have forward PERs in the teens and are expected to report robust operational numbers this year with or without COVID. Facebook is also worth mentioning with a forward PER that is below the S&P500 average. This is the first time that has occurred since Facebook listed in 2012. These are not poorly performing stocks – they have all outperformed the S&P500 over the last 12 months. However, you could say they are currently a little out of favour. This segues back to our earlier suggestion that the retail trade can well help to provide opportunities to buy quality stocks that are unpopular.
Chart: Performance of Select Inexpensive stocks

Source: Bloomberg, Odyssey
Horizon Performance
If you like to receive more information on our portfolios solutions, please contact us here: info@odysseycapital-group.com

Jan 13, 2021 | Press Releases
Introducing Mr John Kakita プロフィール 垣田宜廣氏
 オデッセイ・アセット・マネジメント・リミテッドはオデッセイ・ジャパン不動産部門担当マネージングディレクターに垣田宜廣氏を任命しました。垣田氏は、ファンドやシンジケートによる新規ホスピタリティアセット買収、そのオペレーション及びマネジメント全般を含めた国内の不動産プロジェクトを統括します。
垣田氏は、過去20年間、この業界で様々な要職を歴任してきました。ヒルトン・インターナショナル 日本・ミクロネシア地区セールス&マーケティングディレクターとしてグローバルホテルチェーン運営管理に携わった後、ゴールドマン・サックス・リアルティ・ジャパンでは新たに導入したREIT資産を含む4~5つ星ホテルポートフォリオのアセットマネジメント部門を率いました。日本の大手不動産会社で5つ星ホテルの開発に責任者として従事した経験も持ちます。
直近では、東京の不動産ファンド企業のCIOとして、由緒ある温泉旅館をはじめとしたホスピタリティアセットの開発・資産管理に投資家の立場として携わりました。
垣田氏は、早稲田大学法学部卒業、米国ノースウエスタン大学ケロッグスクールでMBAを取得しました。
Mr John Kakita’s Role at Odyssey 垣田氏の役割
この豊富な経験と実績で、この程立ち上げたオデッセイ・ジャパン・ホスピタリティ・ファンドIIで、より付加価値を生み出す潜在性のある日本の旅館不動産投資へ取り組むことになります。ファンドの主要戦略は、日本の旅館を買収し、リニューアル、リポジション、より質の高い運営することで、お客様に魅力的なおもてなし体験を提供すると同時に、投資家へも魅力あるリターンをもたらすことです。
このファンドがメインにターゲットとするのは、ラグジュアリーブティックホテル、旅館、町屋といったアセットタイプです。その3タイプのいずれかへリニューアル可能で、日本有数の観光地にある歴史遺産的建造物が投資対象となります。
オデッセイ・ジャパン・ホスピタリティ・ファンドIIについて更に詳しい内容は、馬場ゆきまで日本語にてお問い合わせください。yuki.baba@odysseycapital-group.com
Click here to download the full article.
Why Choose Odyssey? オデッセイが選ばれる理由
オデッセイ・グループ・リミテッドは、アジアのミッドマーケットをリードするオルタナティブ アセット マネジメント企業です。オルタナティブ・クレジット、不動産、プライベート・エクイティ、ヘッジファンド等資産クラス別マルチアセットを取り扱い、差別化を図り、ご要望に応じた投資ソリューションを提供します。クライアントと共同で潜在的に付加価値を生み出せる資産への投資機会の発掘に注力します。
オデッセイチームには、37名以上の経験豊富なアセットマネージャー、弁護士、プライベートバンカー、信託・税務プランの専門家、ベテラン投資家といった各分野の優秀なメンバーで構成されています。アジア太平洋地域、ヨーロッパ、北米においてそれぞれ平均22年に及ぶファイナンス、執行、運用の実績をもちます。
オデッセイチームのこの経験こそが、リージョナルの幅広い業界専門知識、グローバルマクロ経済や地政学的トレンドの洞察と強力なグローバルネットワーク関係構築を可能にします。
目標とする成果達成のために総力をあげて取り組むことで、オデッセイ・グループと提携するクライアントには幅広く深い専門知識をお役立ていただけます。
当社の革新的なアプローチは、慎重かつ長期的な視点で魅力的な投資収益を生み出します。
投資パートナーとの高水準で長期的な利益の一致を追求するために、ビジネスパートナーとして高い能力をもつプロフェッショナルがオデッセイには揃っています。お客様のニーズに応える「信うr頼のパートナー」となることが私たちの信条です。
弊社へのお問合せ・アジアで最も魅力あるオルタナティブ投資機会について更にお知りになりたければ、馬場ゆきまで日本語にてお問い合わせください。yuki.baba@odysseycapital-group.com
このプレスリリースコンテンツはご自由にシェアいただけます。

Jan 13, 2021 | Press Releases
Odyssey Launches 2nd Japanese Hospitality Fund オデッセイジャパンホスピタリティファンドII ローンチ
オデッセイ・ジャパン・ブティック・ホスピタリティ・ファンドIでは、過去18ヶ月にかけて有利で魅力的な投資を行ってまいりました。時の経過とともに、目標である8%の利回りと15%のIRRの投資リターンをもたらすことができるとの確信に至っております。そして、このジャパンファンドIの好調を受けて、オデッセイ・ジャパン・ホスピタリティ・ファンドIIが設立されました。
オデッセイ・ジャパン・ホスピタリティ・ファンドIIで、より付加価値を生み出す潜在性のある日本の旅館不動産投資へ取り組むことになります。ファンドの主要戦略は、日本の旅館を買収し、リニューアル、リポジション、より質の高い運営することで、お客様に魅力的なおもてなし体験を提供すると同時に、投資家へも魅力あるリターンをもたらすことです。
このファンドがメインにターゲットとするのは、ラグジュアリーブティックホテル、旅館、町屋といったアセットタイプです。その3タイプのいずれかへリニューアル可能で、日本有数の観光地にある歴史遺産的建造物が投資対象となります。
Focused Fund capitalising on COVID-19 コロナ禍(COVID-19)においての投資
日本のメジャーなREITやグローバルPE / REファンドとの競争が比較的少なく、取引額が500万~5000万米ドルのミッドレベル価格レンジの買収に的を絞ることで、ファンドと投資家共に、より有利な評価で買収時の利回りを得られます。
このファンドは、ブティックホスピタリティアセットというニッチなマーケットへ焦点を絞り、国内不動産市場の成長を見込んだまたとない投資の機会となります。日本の豊かな文化財とエレガントでクラシックなデザイン様式は美観に優れ、思い出に残るおもてなし体験を提供できるモダンでラグジュアリーなホスピタリティアセットへ再生するための理想的な条件を兼ね備えています。
このファンド戦略に強い関心が寄せられる中、過去6ヶ月間に開拓したパイプラインから第一号案件の取得に期待を寄せています。
Targeted Returns 目標利回り
このファンドは、少なくとも8%の年間利回りと15%以上のIRR、またはその手数料を上回る利益を生み出す買収を対象としています。
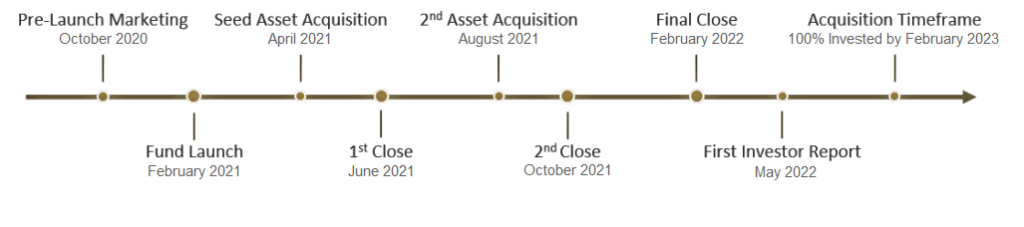
Key Dates
Macro Conditions マクロ経済の状況
日本のホスピタリティ資産取得のタイミングとしては、現状、周期的に訪れる日和見状態にありますが、魅力的な利回りと組み合わせることで、ファンドが投資家に大きな増益を提供できる投資機会であると、オデッセイは捉えています。
現在、日本のホスピタリティ不動産市場ファンダメンタルズを見ると、高い需要に対し供給不足という前提に基づき、稼働率と客室料金アップ(ADR)促進を後押ししています。
COVID-19 Contrarian Play コロナ禍(COVID-19)だからこその投資
インターナショナルツーリズムセクターは、コロナ(COVID-19)以前のマクロ経済レベルの堅調な成長により好調に推移しておりましたが、長年の構造的要因によりアフターコロナ(COVID-19後)にも再び元の状況を取り戻すと想定されます。また、日本のホスピタリティセクターは、常に国内の安定したツーリズムマーケットの恩恵を受けており、国内市場はコロナ禍においても各地方の経済回復と利益を牽引し続けています。
ターゲットとするアセットは、インバウンド、国内旅行双方の需要へアピールするものとなります。それぞれのマーケットがその時の状況に応じて、同時にも個別にも使い分けてターゲット設定することが可能です – コロナ禍(COVID-19)でそうであったように、国内の顧客へ方向転換してフォーカスすることでうまくいく例は、既に立ち上げたファンドIのアセットで実証されています。
The Perfect Time to Invest 絶好の投資機会
仮に市場が12~18ヶ月後に回復し、訪日旅行客が再び増加すると想定した場合、一度市場が安定すれば、現在延期されているオリンピックを含む国際的な需要ドライバーが、政府支援を受けて、稼働率とADR強化をもたらすことで資産評価アップへつながることになります。
市場安定までの12~18ヶ月の遅れは、さらなるデューデリジェンスの実施や買収の完了、必要な強化と対策、また、出入国制限解除後の渡航再開を見据えたリポジションのためには、理想的なタイムフレームとも言えます。アセットリポジショニングと資本効率向上に不可欠な施設の休業による影響は限定的にとどめられ、オペレーション削減から生じる混乱も最小限に抑えられます。
その結果、今後12ヶ月間で、大幅値引き物件の(最大で50%ディスカウントも散見される)オフマーケット取引を実行することができ、インターナショナルマーケットの回復に先んじて、強力な国内市場を狙ったリポジショニングとリノベーションがより高い収益を確保し、優れたリターンを提供することになります。
これらのファクターがコロナ(COVID-19)によりまたとない投資機会をもたらし、当社の投資戦略は、多くのファンド機関からも追随されています。
ご不明な点がございましたら、馬場ゆきまで日本語にてお問い合わせください。yuki.baba@odysseycapital-group.com
Click here to download the full article.
Why Choose Odyssey? オデッセイが選ばれる理由
オデッセイ・グループ・リミテッドは、アジアのミッドマーケットをリードするオルタナティブ アセット マネジメント企業です。オルタナティブ・クレジット、不動産、プライベート・エクイティ、ヘッジファンド等資産クラス別マルチアセットを取り扱い、差別化を図り、ご要望に応じた投資ソリューションを提供します。クライアントと共同で潜在的に付加価値を生み出せる資産への投資機会の発掘に注力します。
オデッセイチームには、37名以上の経験豊富なアセットマネージャー、弁護士、プライベートバンカー、信託・税務プランの専門家、ベテラン投資家といった各分野の優秀なメンバーで構成されています。アジア太平洋地域、ヨーロッパ、北米においてそれぞれ平均22年に及ぶファイナンス、執行、運用の実績をもちます。
オデッセイチームのこの経験こそが、リージョナルの幅広い業界専門知識、グローバルマクロ経済や地政学的トレンドの洞察と強力なグローバルネットワーク関係構築を可能にします。
目標とする成果達成のために総力をあげて取り組むことで、オデッセイ・グループと提携するクライアントには幅広く深い専門知識をお役立ていただけます。
当社の革新的なアプローチは、慎重かつ長期的な視点で魅力的な投資収益を生み出します。
投資パートナーとの高水準で長期的な利益の一致を追求するために、ビジネスパートナーとして高い能力をもつプロフェッショナルがオデッセイには揃っています。お客様のニーズに応える「信うr頼のパートナー」となることが私たちの信条です。
弊社へのお問合せ・アジアで最も魅力あるオルタナティブ投資機会について更にお知りになりたければ、馬場ゆきまで日本語にてお問い合わせください。yuki.baba@odysseycapital-group.com
このプレスリリースコンテンツはご自由にシェアいただけます。
オデッセイ・日本ファンドチーム
 ジェームス・ウィーラー
機関投資家営業 マネージングディレクター
マニュライフ、その他独立系アセットマネジメント会社においてアジア、中東、ヨーロッパにおける15数年の機関投資家営業の経験を持ち、グローバルな機関投資家の投資業務に携わってきた。様々な投資商品における豊富な経験と知見を持つ。
 ダニエル・ボービル
オデッセイ社長/�投資総責任者
マッコーリー銀行、スタンダード・チャーター銀行の投資銀行部門アジア地区のディレクターを経て、オデッセイグループを設立し、グループの投資、営業部門を総括。不動産プライベートエクイティにおいては20数年の経験を持っている。
 垣田 宜廣
垣田 宜廣
ポートフォリオ責任者 マネージングディレクター
ヒルトン日本・ミクロネシア地区マーケティングディレクターを経てゴールドマンサックスリアルティジャパンにおいてホテルポートフォリオ アセットマネージメントの責任者。
その後東証一部上場不動産ホテル開発責任者、不動産投資ファンドCIOなどホスピタリティアセットマネジメントの枢要職務を歴任。
 サム・ラック
ディレクター / オペレーション責任者
ファンド、また不動産業務のオペレーション業務を担当
 馬場 ゆき
馬場 ゆき
シニア・アドバイザー
旅館オーナーで、旅館投資、再生、オペレーションを専門とするシニアアドバイザー

Jan 8, 2021 | Articles, Global Markets Update
January Market View
Equity Market Recovery – Historical Context
The very optimistic November market sentiment carried over to December. Again, all risk assets recorded robust gains, albeit at a lower rate than the previous month. The big question now is whether the strong momentum shown in the last two months can carry over into the New Year.
“Unprecedented” is a word often used about the COVID crisis and certainly most of us have never experienced a similar situation. While it is also an unprecedented situation for the financial markets, broad equity index performances have certainly experienced a similar backdrop. In the last 50 years we have seen a similar rate of recovery from market lows three times – from September 1974, July 1982, and of course from February 2009 during the GFC. It is interesting to note that in these three periods, and indeed for the recovery of all seven previous drawdowns in the last 50 years of greater than 20%, that there appears a significant resistance level after the MSCI World Index approaches 40-50% recovery. Ominously, we are about there now in this recovery.

Source: Bloomberg, Odyssey
As market veterans realise, every situation is slightly different, and this time may end up reacting very different than history. However, markets also do tend to repeat themselves in a broad sense. At the end of the day, none of us have a crystal ball, so we advise investors not to get caught up with the hype and stay disciplined with their risk allocations and investment decisions.
The short-term question is what the January performance will look like and whether that is a harbinger for 2021 performance. While there is plenty of statistical evidence for “Sell in May and Go Away” until November, the evidence for January is less clear cut. In the last 50 years, the proportion of times both January and the full year return was positive is just 54%. You don’t need to run the stats on that to realize the two are not correlated. The proportion of times that January is positive is 64%, again hardly something to get excited about. Compare that to the 78% of years where the month of December is positive.
Why is the Equity Market so Much Higher than pre-COVID?
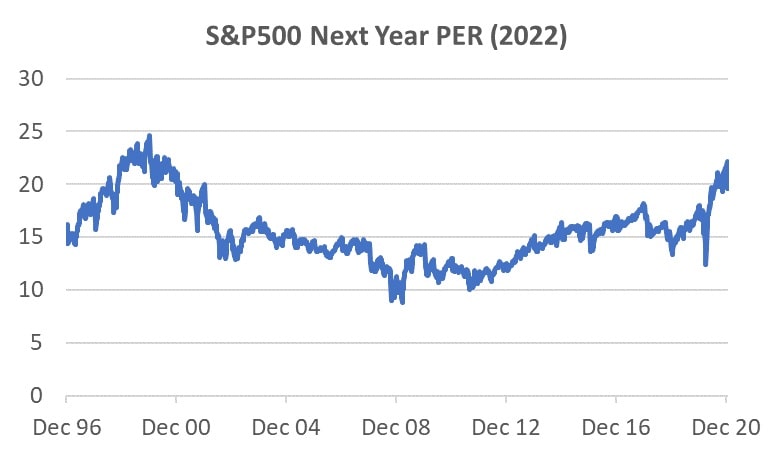
The simple answer is valuation multiple expansion. Optimists may say that valuation multiples should be high at the bottom of the economic cycle and low at the top. This phenomenon can be seen in many cyclical industries. However, for the market as a whole, there is little empirical evidence for this. The only time we have seen forward PER estimates this high was during the Dotcom boom and that was a speculative rally. Under this scenario, stock prices rise if the gain in EPS is higher than the fall in the EPS multiple. How does the maths stack up when looking at the S&P500 and consensus EPS forecasts? The S&P500 is trading on a next year (2022) forward PE multiple of 19.5x. This is 32% higher than the 13.3x multiple in 2010-2015 period in the years when the market was climbing out of the GFC when we also had zero interest rates. The market is expecting earnings growth to slow in 2022. If we assume this as peak cycle, we would expect the forward PE ratio to fall at least back towards the average of 13.3x, if not below. This means 2022 EPS expectations need to be 42% higher than 2020 level and 22% higher than the very strong 2019 level in order for the market to merely stay flat. This appears a tough ask.
However, should the market believe a higher market multiple is justifiable for longer, then the reliance on EPS growth is lower. This situation may play out should the recovery appear strong in 2021, providing the expectation strong growth will remain for 2022. Periods of high valuations can persist, as they did in the late 1990s, and while they have historically always reverted to mean, the timing is difficult to predict.
Source: Bloomberg
Diminishing Choices
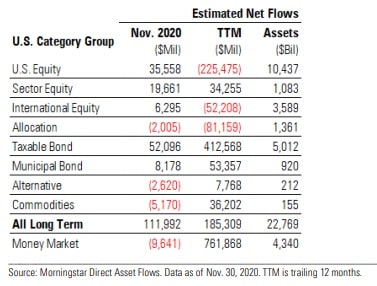
Since the trough of the equity market in March 2020, the MSCI World Total Return Index has surged by a staggering 70%. However, despite positive inflows in November after the US elections, US equity has experienced fund outflows in a trend that has persisted since 2015. In the liquid space the main beneficiary has been credit and in the illiquid space, while transactions have slowed significantly, the growing popularity of private equity, credit and real estate appears undiminished.
The positive takeaway from this for equity markets is that it appears investors are underweight equity, and its most liquid rival for fund flow, bonds, is providing a historically low yield. The Bloomberg Barclays Global Credit Index is currently yielding 1.4%. It is doubtful many investors, private or institutional, would be satisfied with that return, even for a relatively “safe” asset class.
Performances
December Returns
If you like to receive more information on our portfolios solutions, please contact us here: info@odysseycapital-group.com